 The median home sales report for March 2021 is ready to go, providing both home sellers and home buyers valuable insight into present activity in the Tallahassee real estate market.
It shows that the median home price in Tallahassee continues moving higher at an unhealthy rate, and it shows home sellers are now receiving higher values than ever before. Most importantly, it gives us the ability to forecast important metrics for both buyers and sellers.
In today’s report, we’ll look at the median home price, median home value, and median home size in two separate ways.
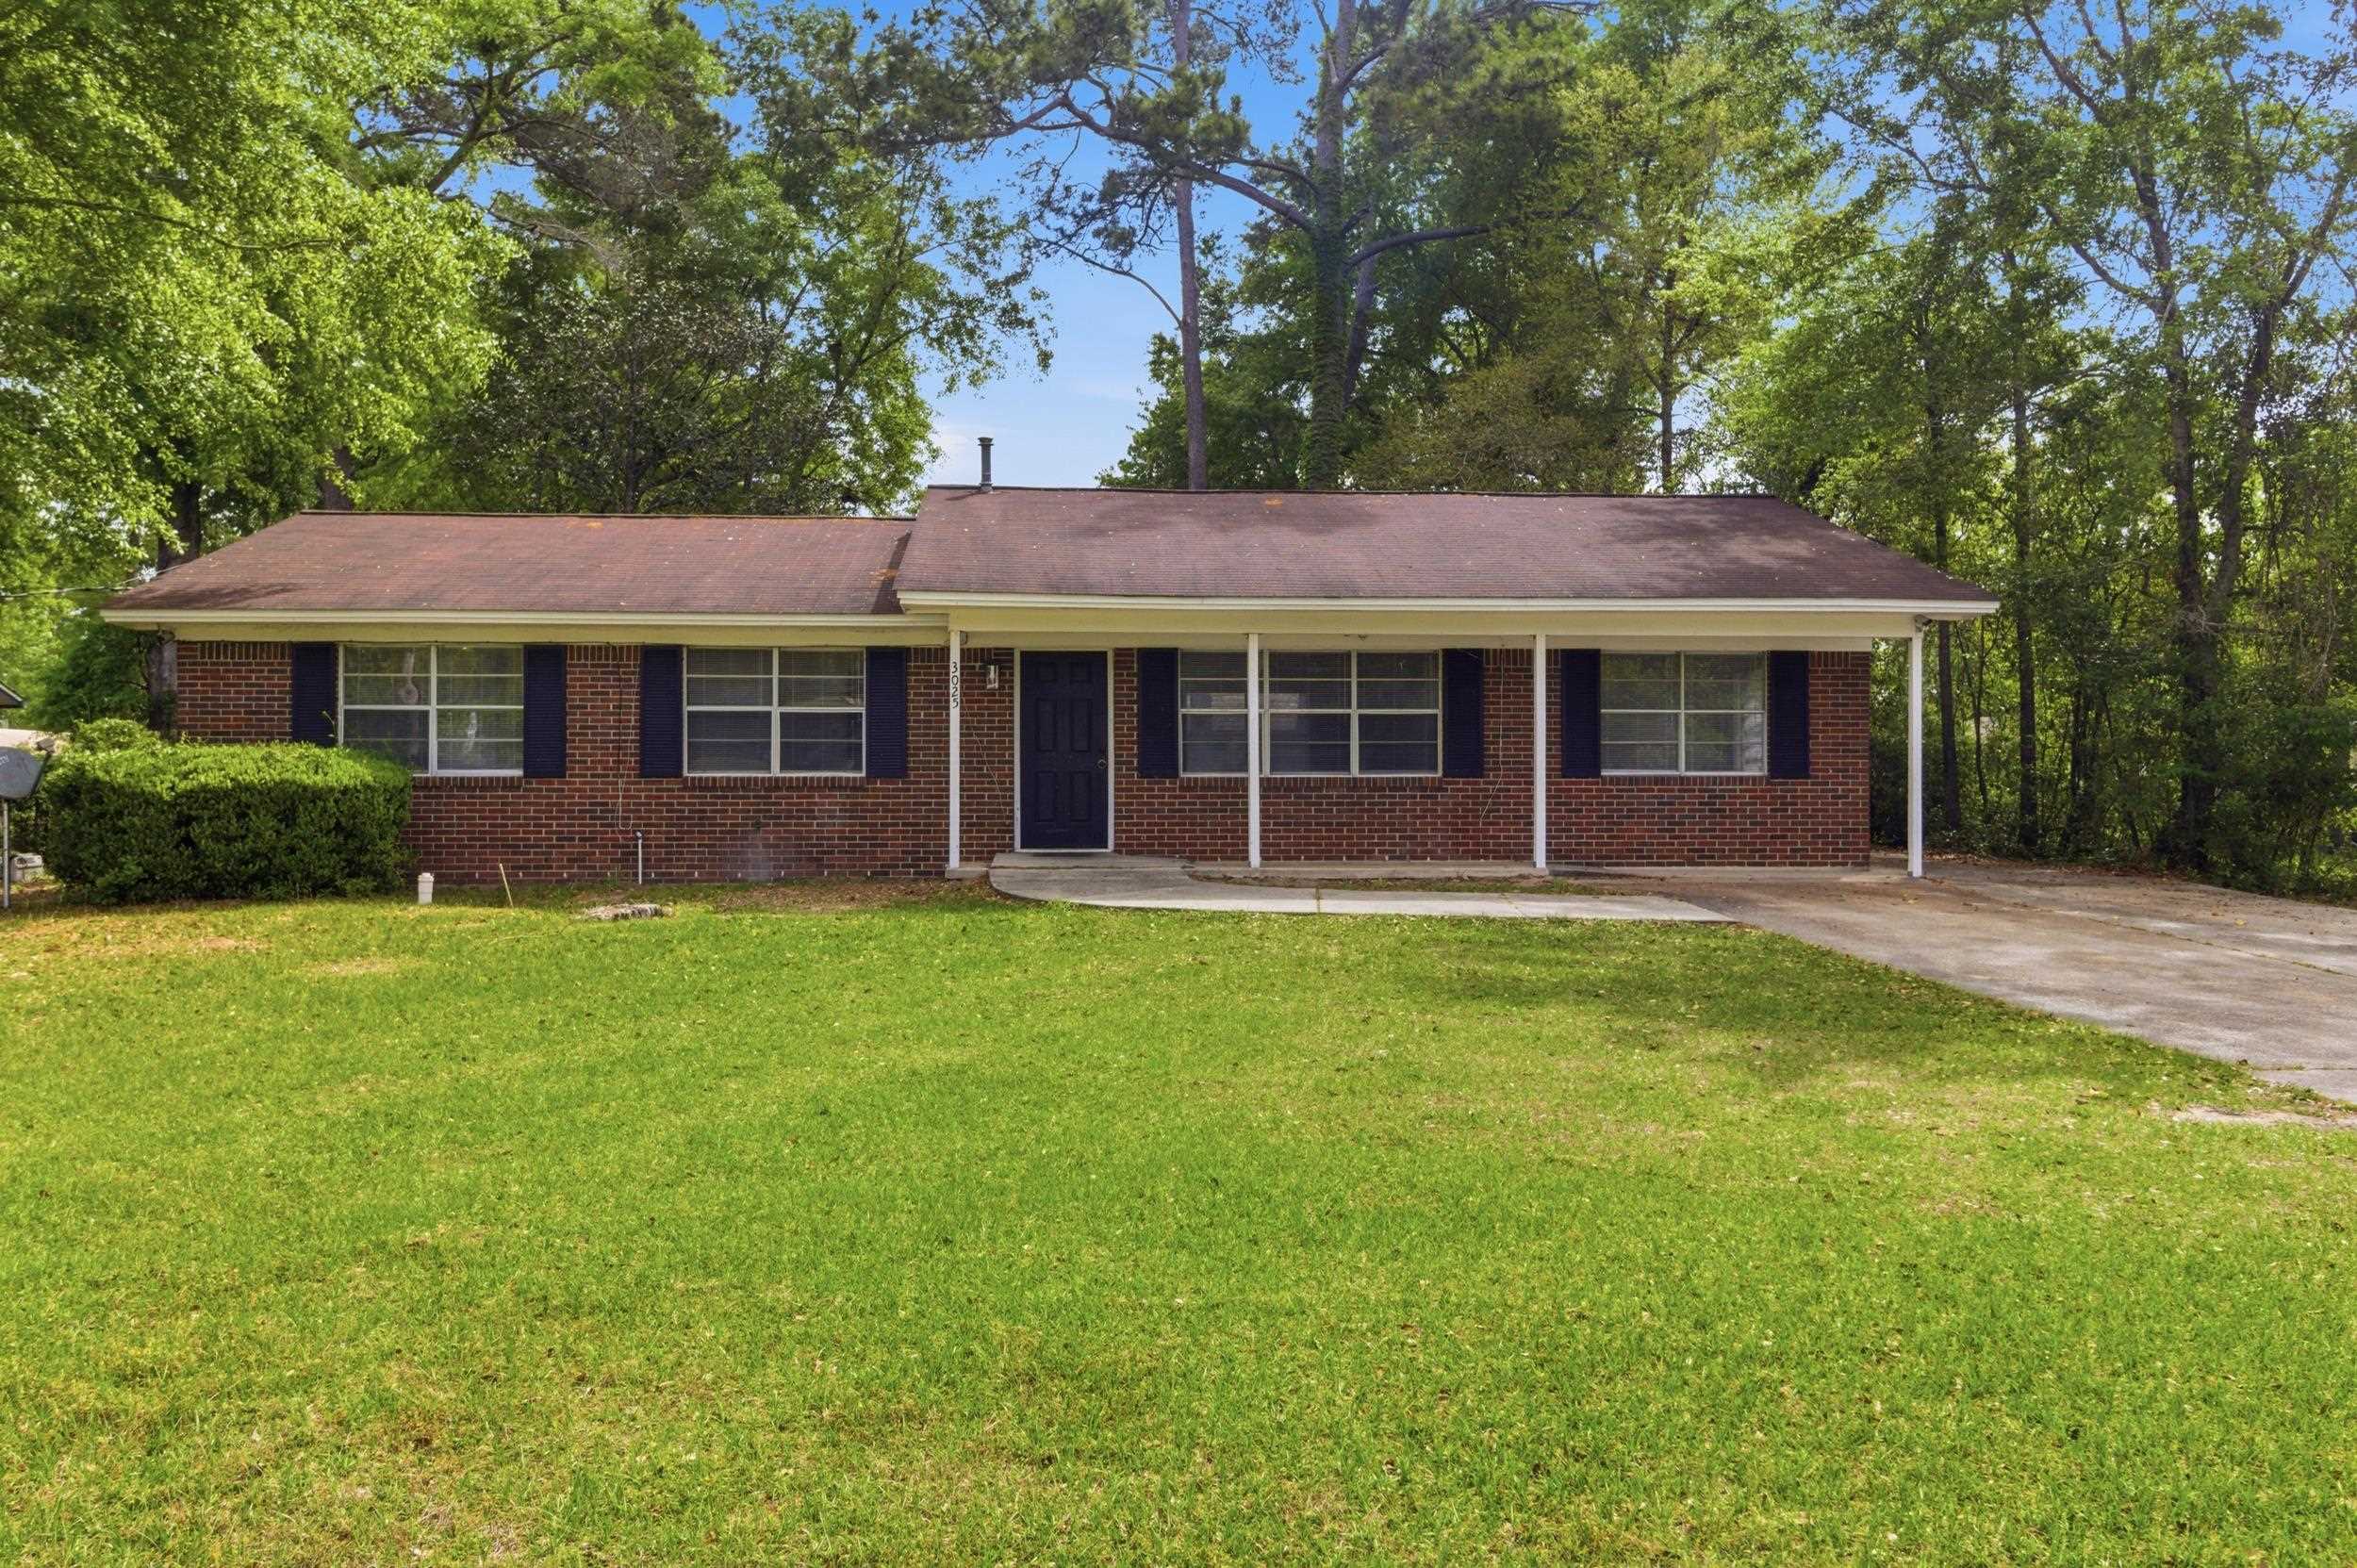
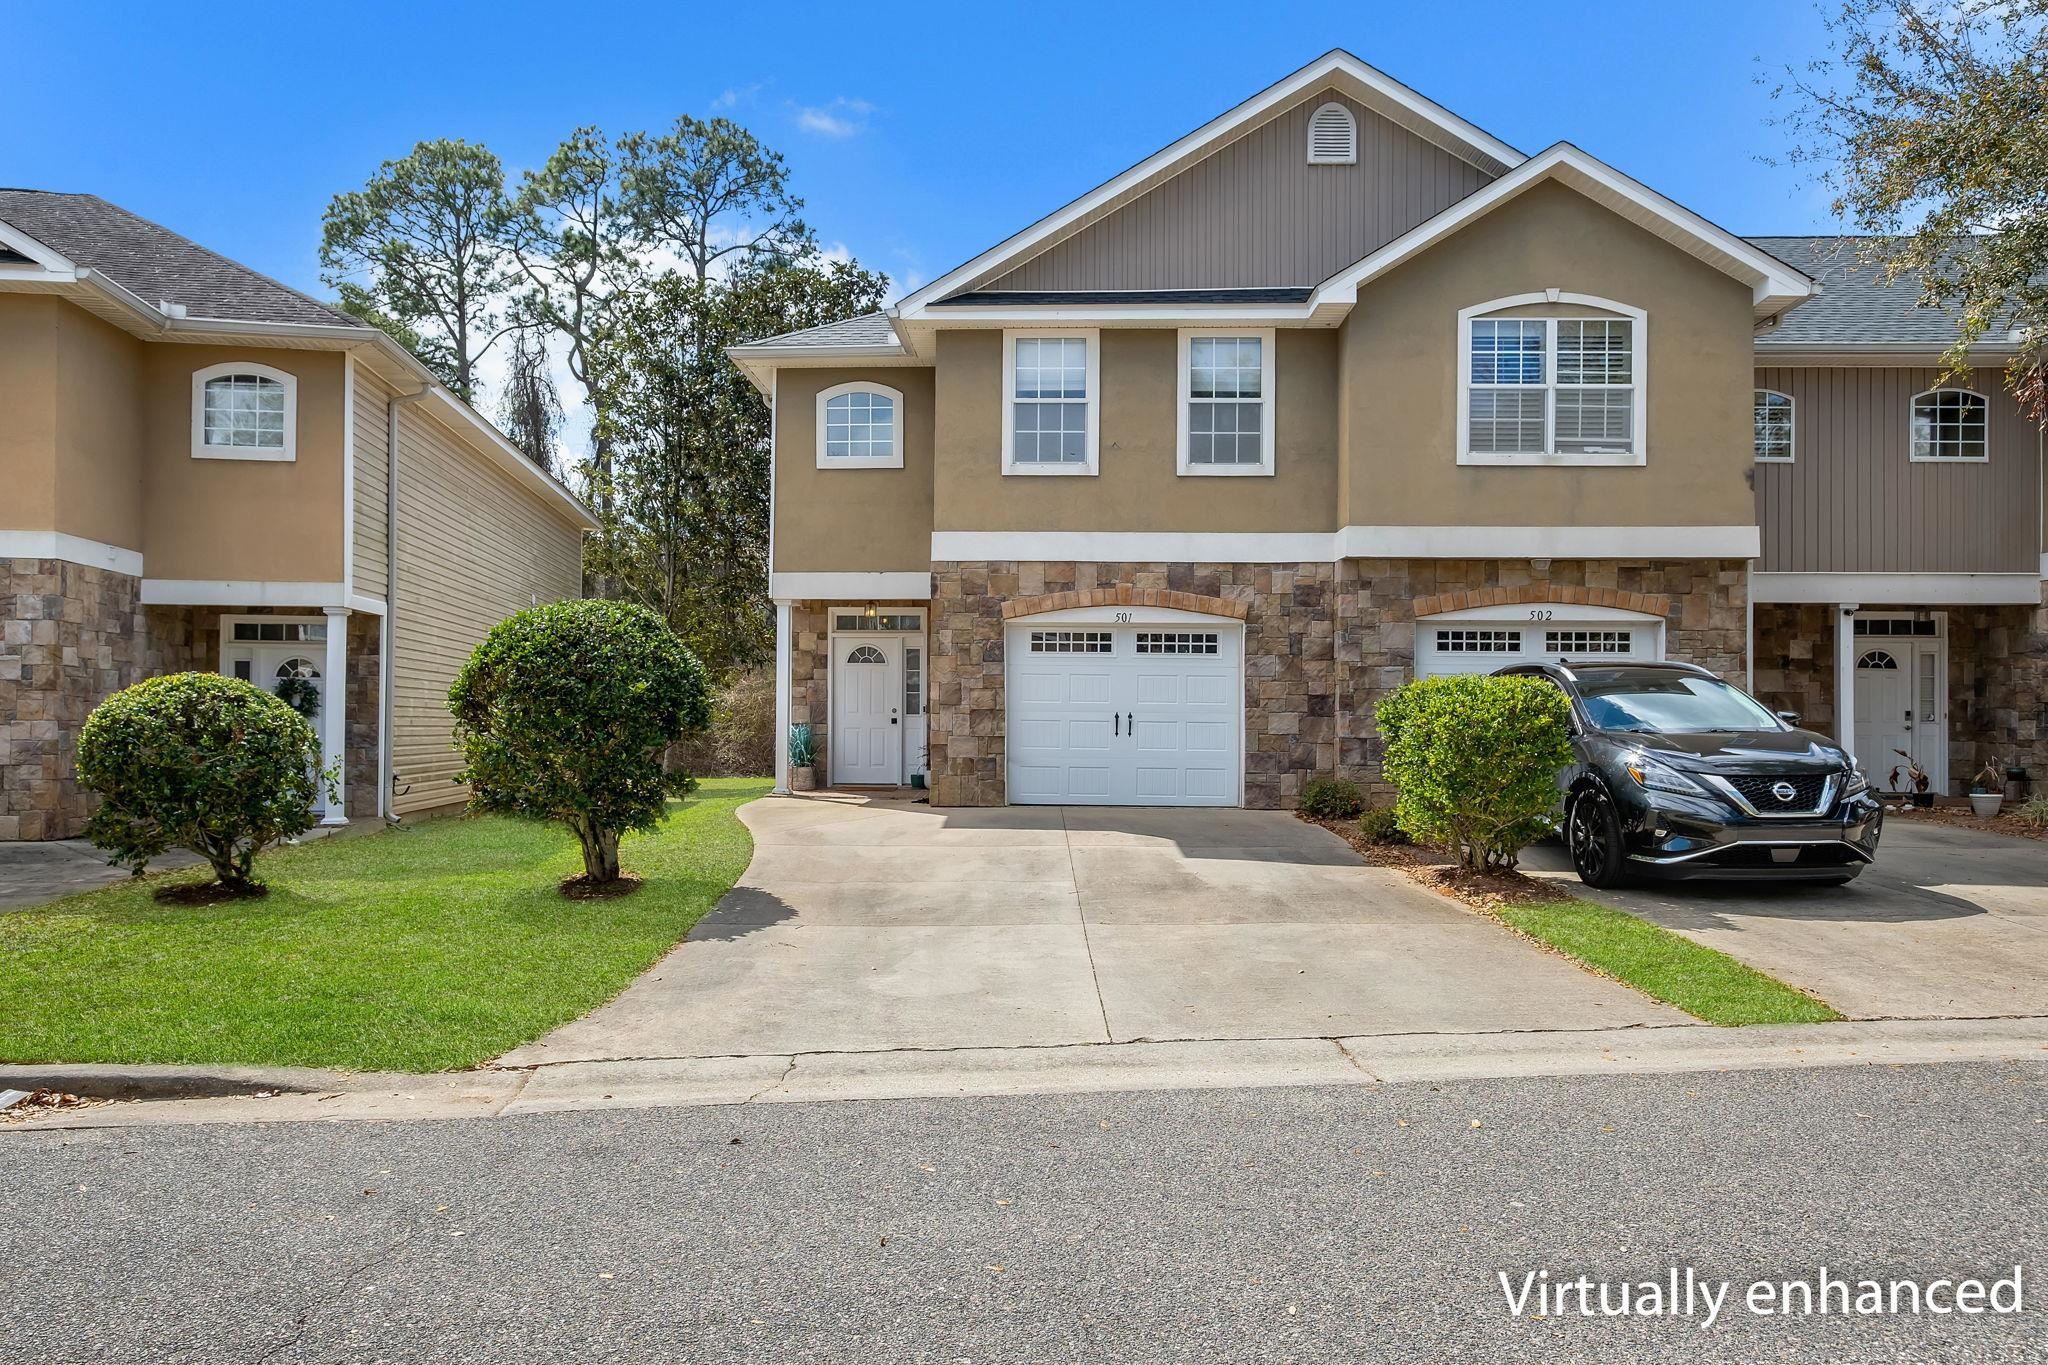
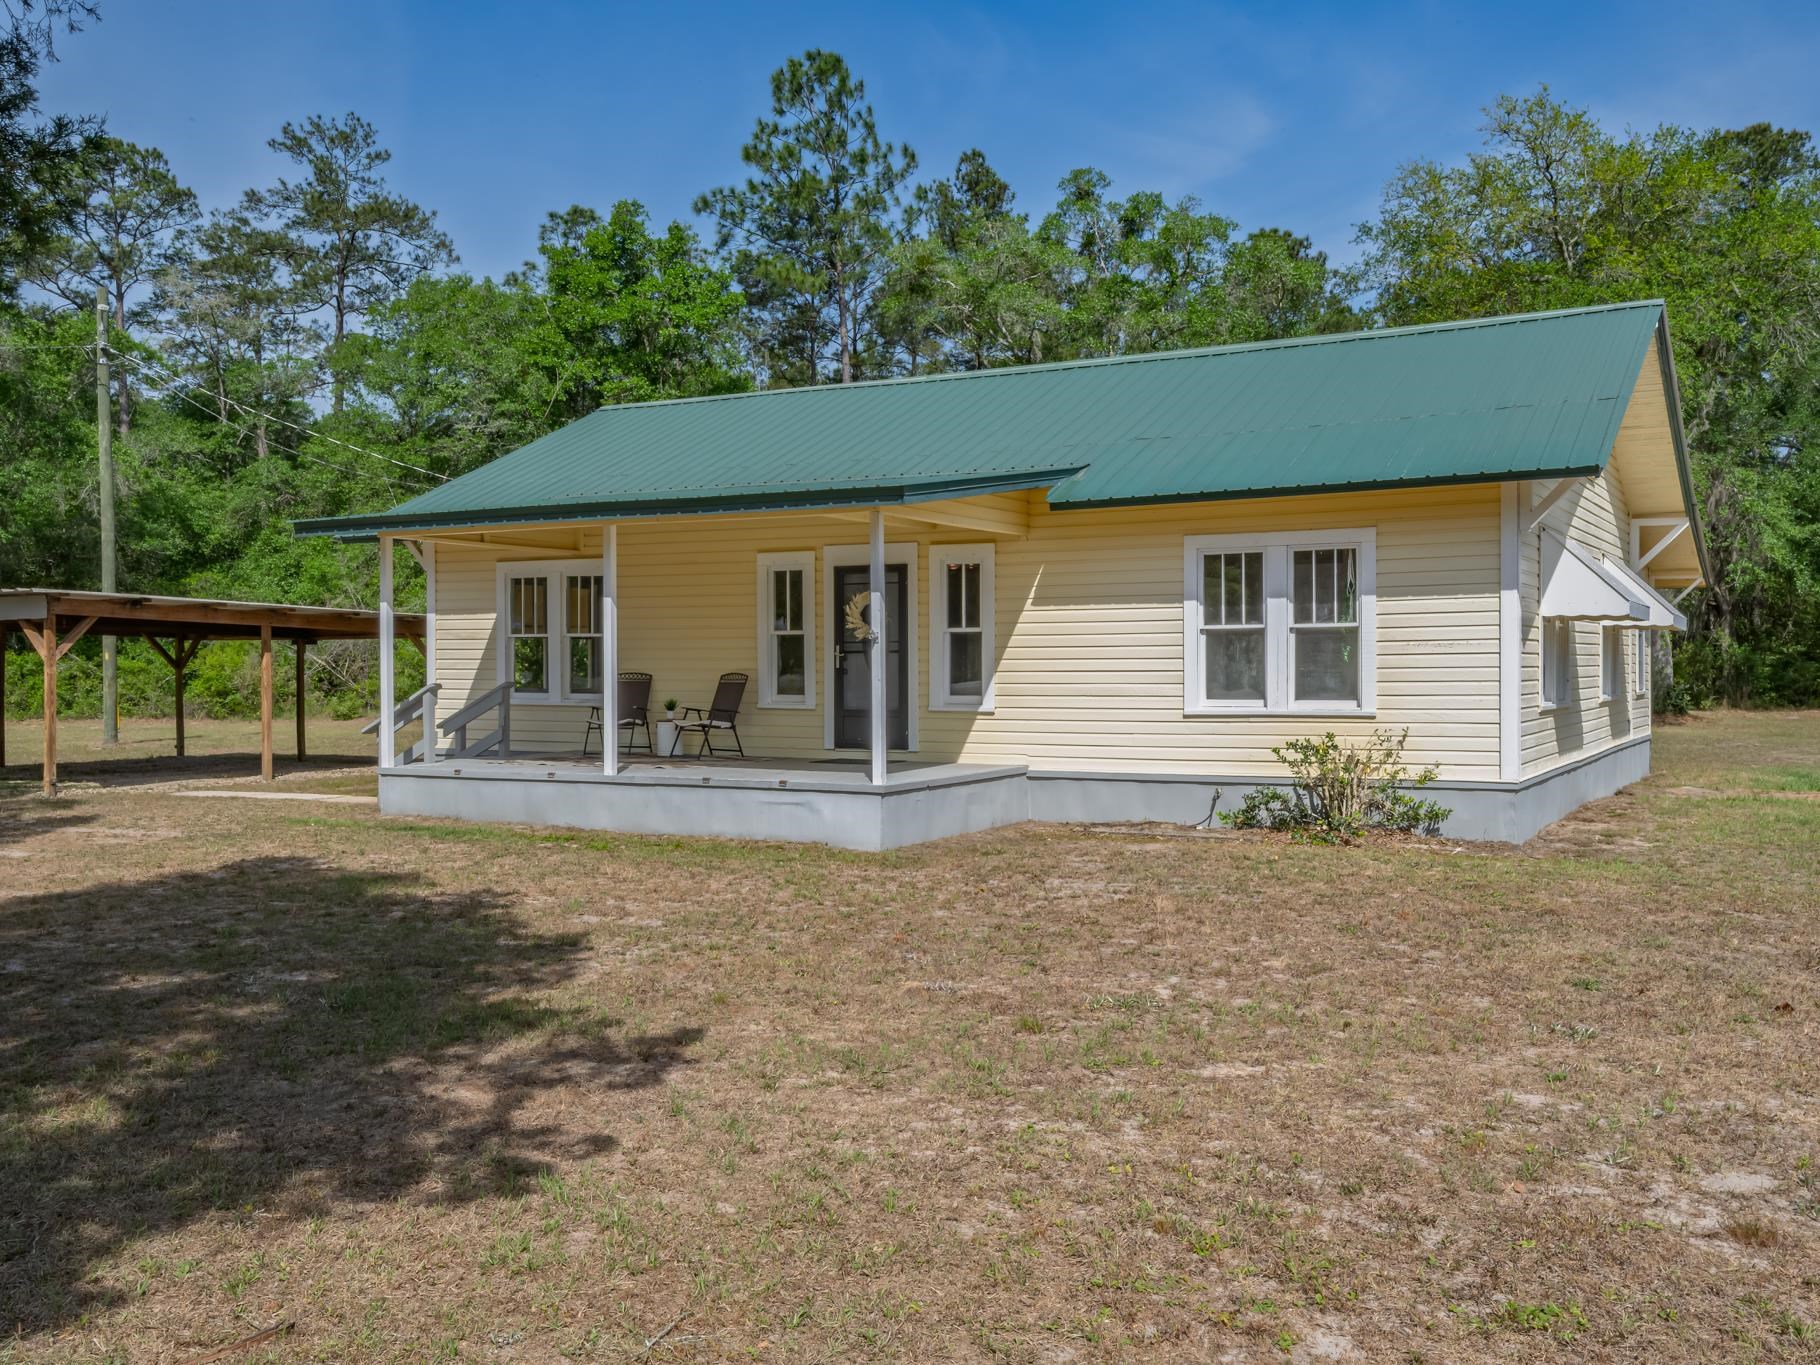
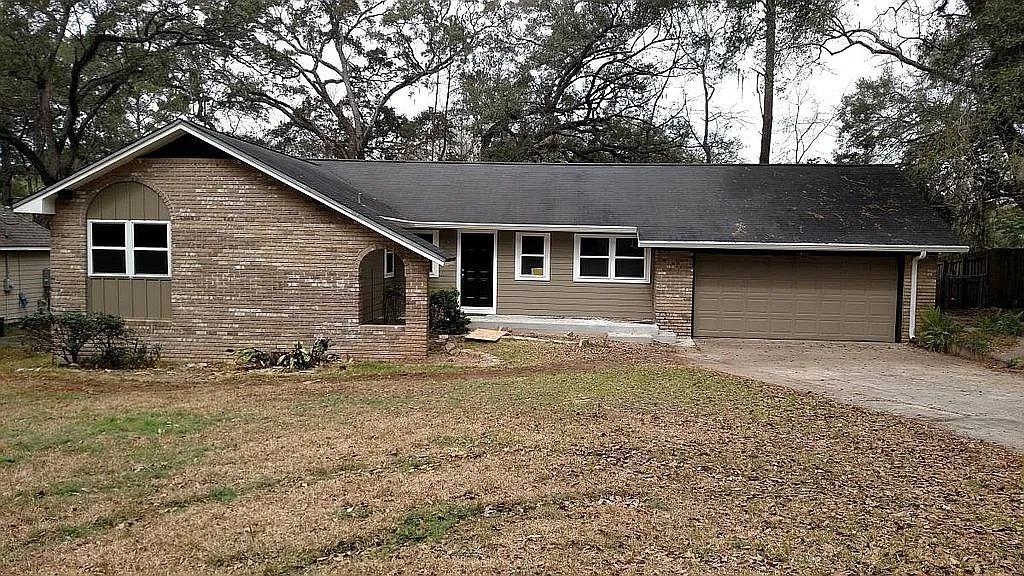
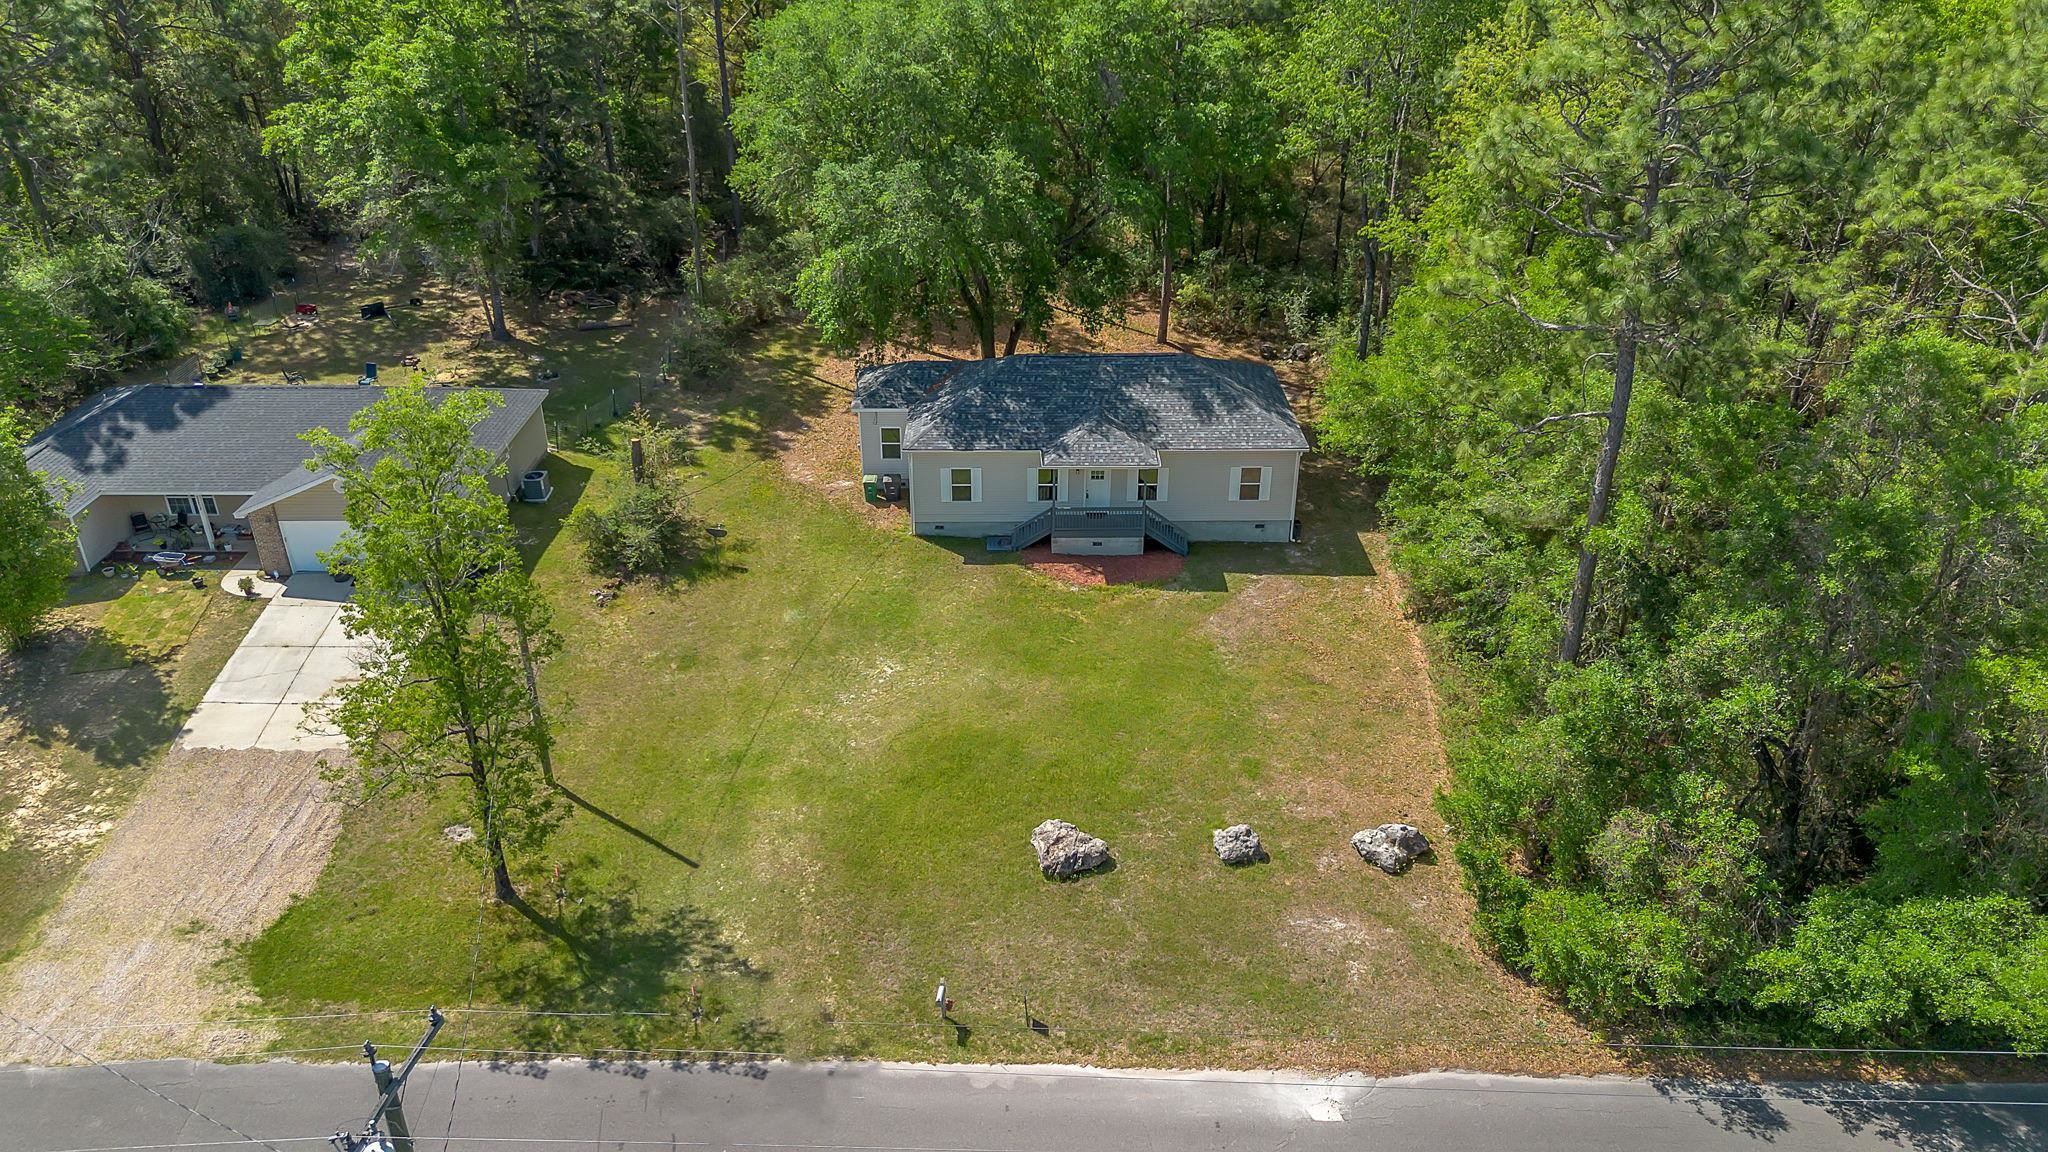
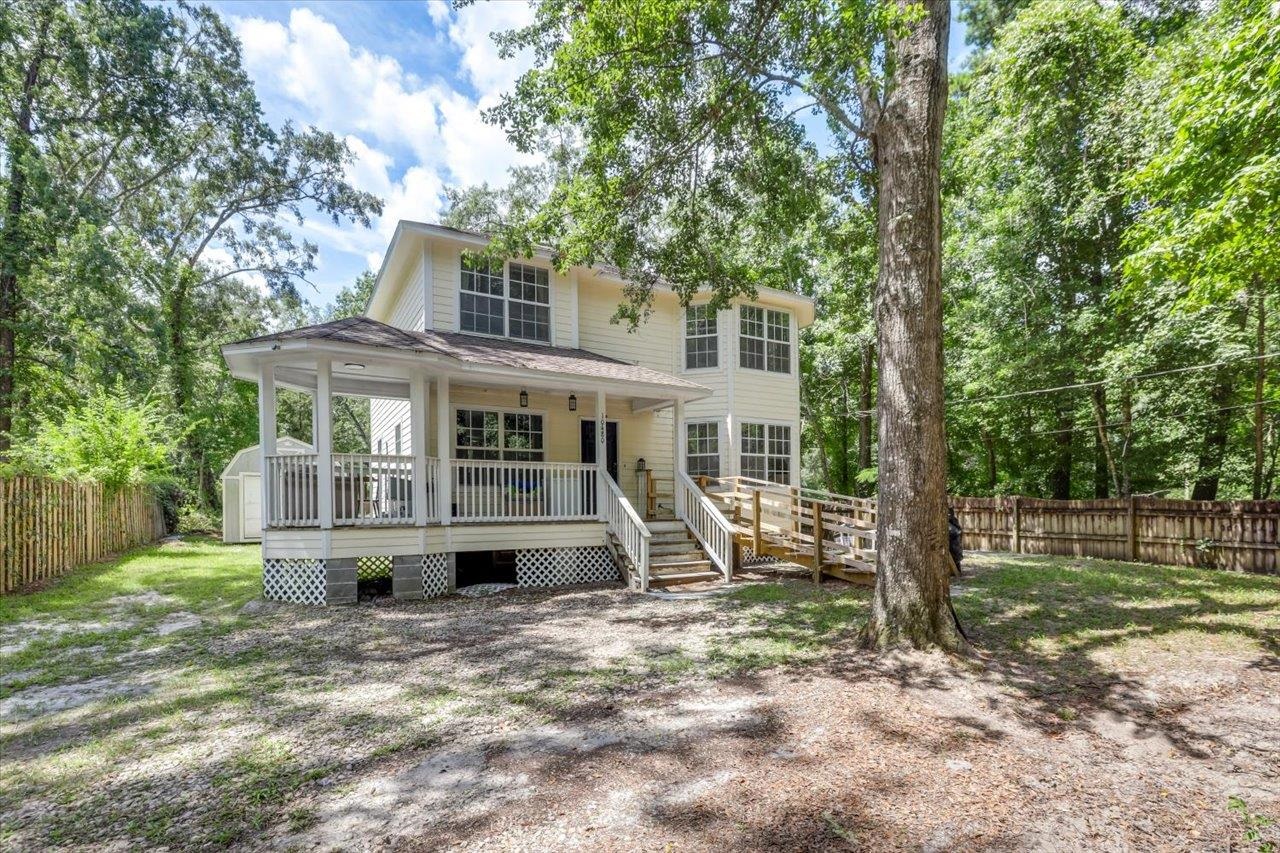
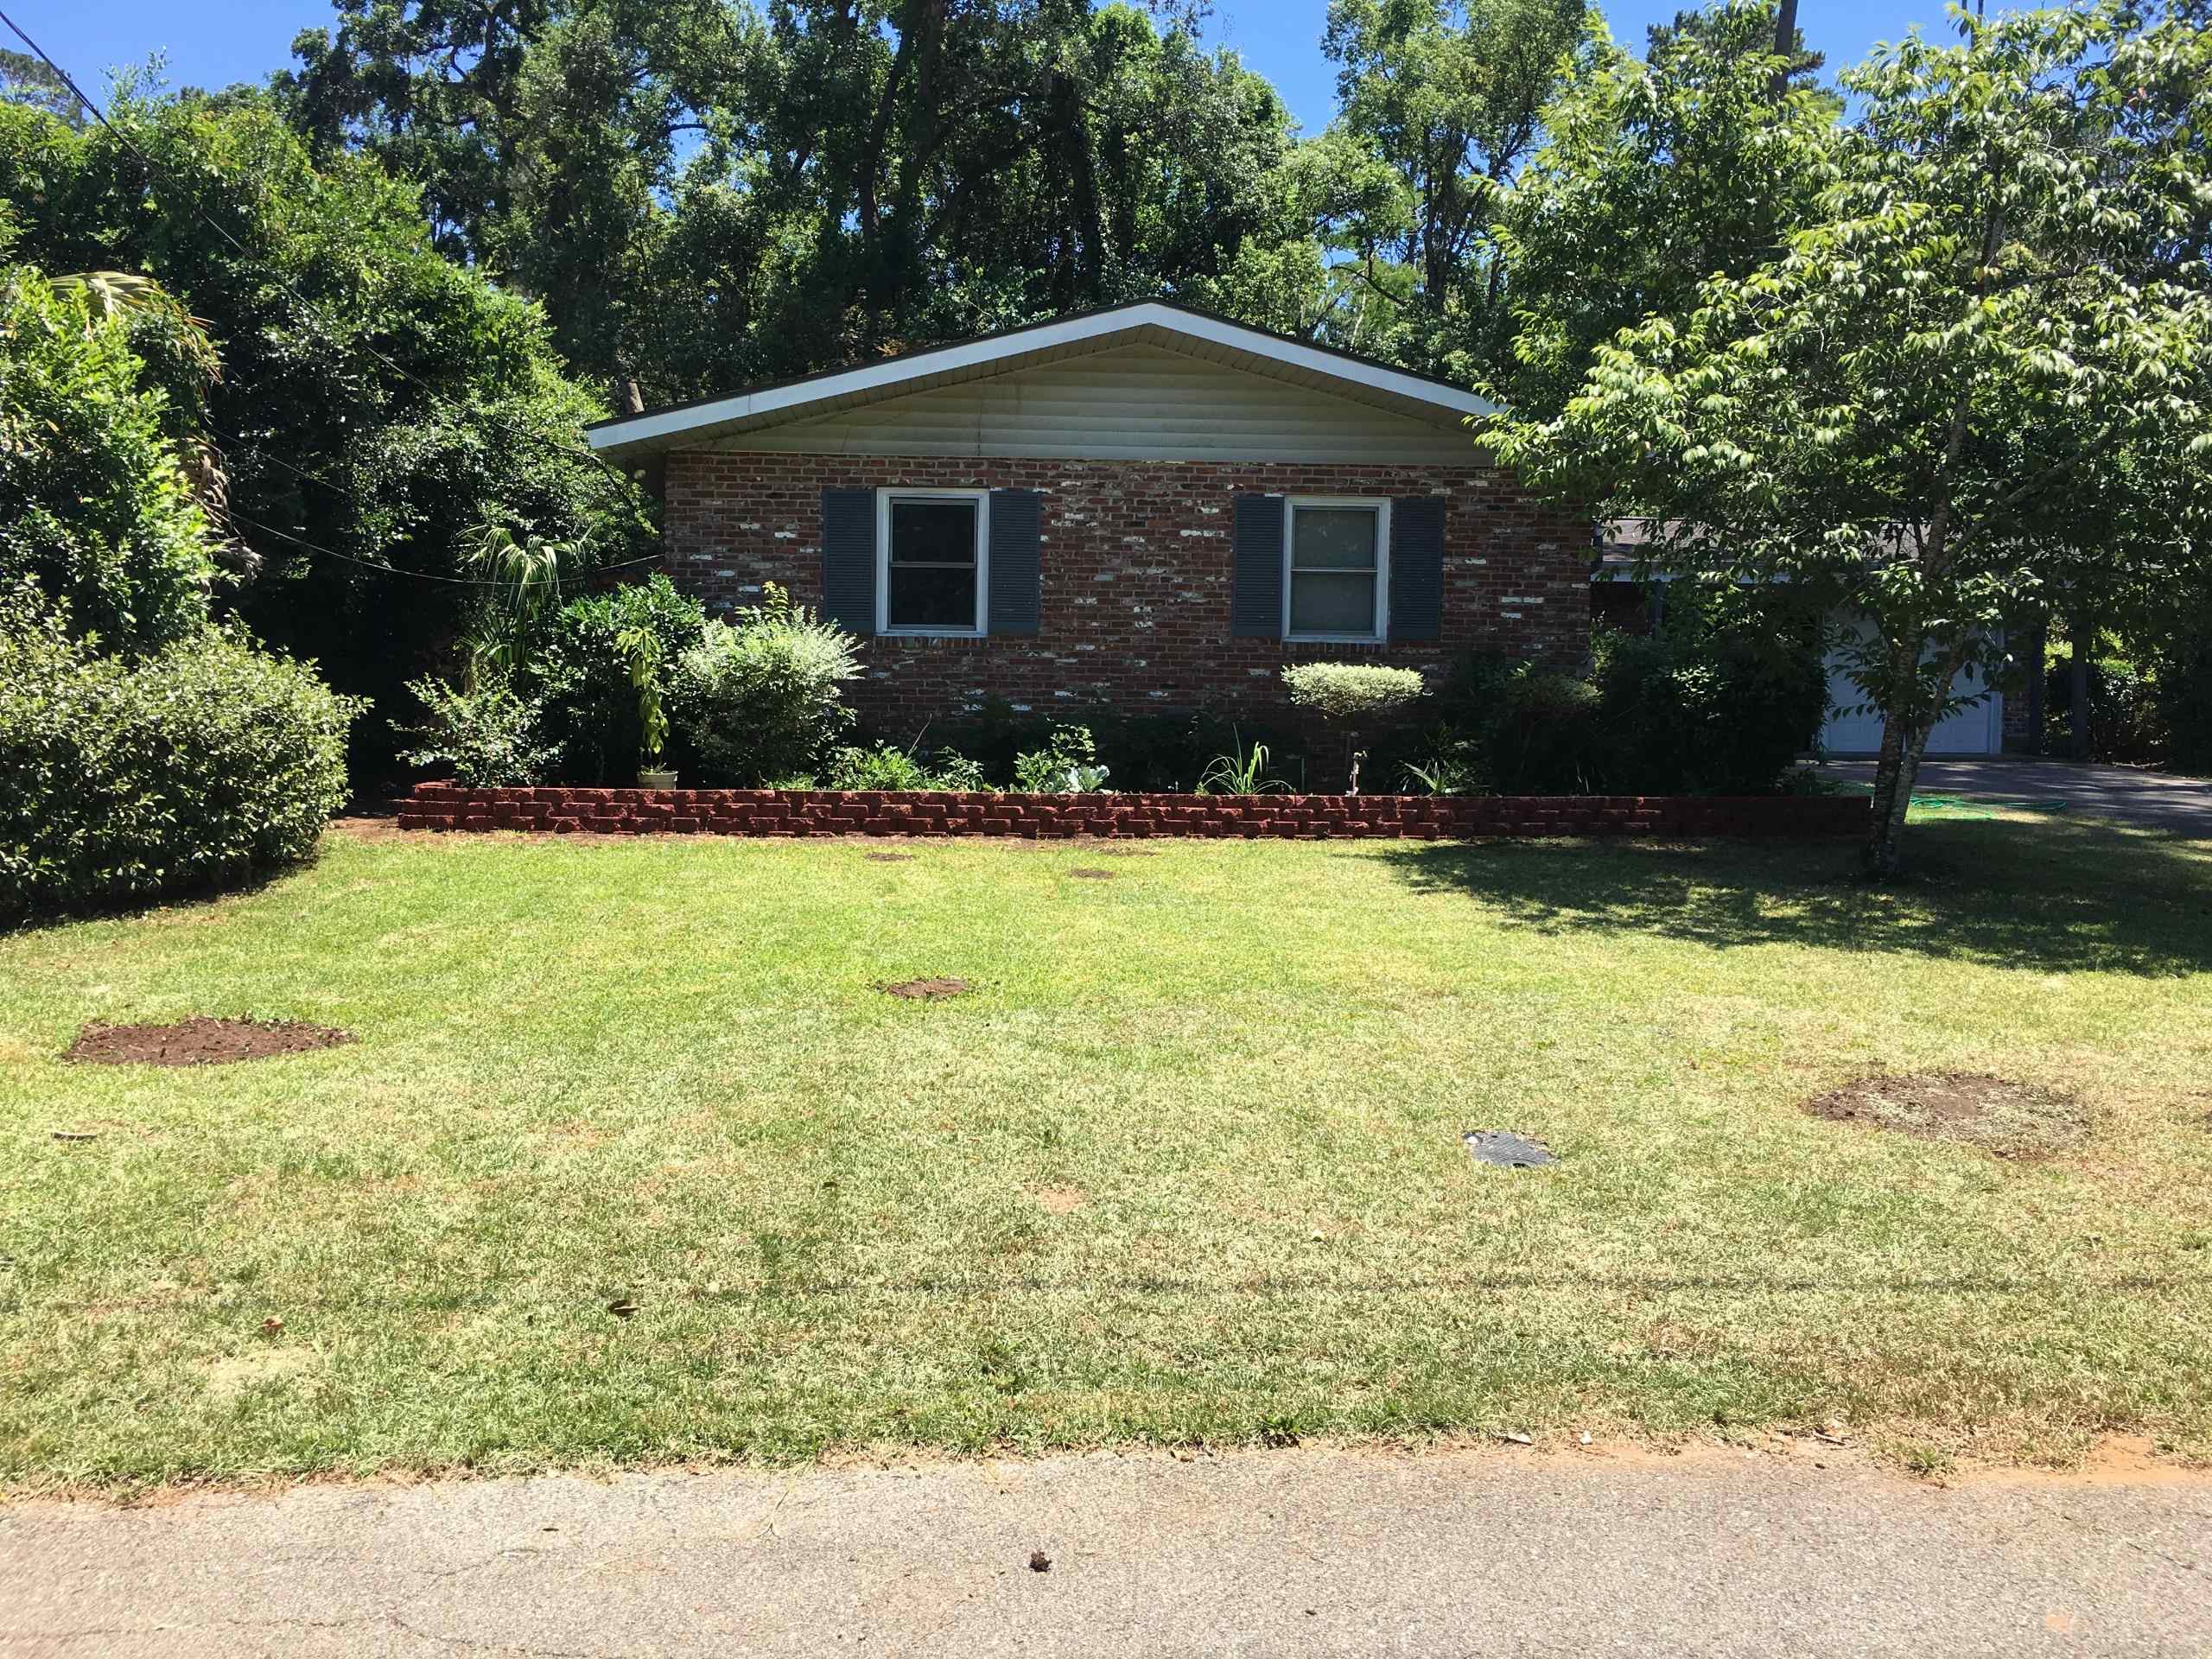
First, let’s take a look at the active listings priced near today’s median home price. Note how many of them are already under contract with a buyer. The market remains blistering hot!
Median Priced Houses For Sale In Tallahassee
Homes For Sale Priced Near The Median


VIDEO: Median Home Sales Report
Our first three graphs in the report segment the market by property type, allowing us to discern the median for single-family detached homes, townhomes, and condominiums.
Median Home Price In Tallahassee
The first graph examines the median home price, segmented by property type. What it reveals is that the median single-family detached home price is performing better than is the median single-family attached home price.

In the graph above, detached homes are plotted in red, while attached homes are plotted in blue (solid line for townhomes and dashed line for condominiums).
The first thing that catches my eye is that the median home price for single-family detached homes is at an all-time high, leaving the past high years well behind it. But that is not the case for the attached homes. Though the townhome median price is finally approaching an all-time high, the median condominium price continues to struggle.
Here’s how the median home price has changed since the previous market peaks in 2006 and 2007:
- Single-Family Detached Homes: UP 18% since 2007
- Townhomes: DOWN 6% since 2006
- Condominiums: DOWN 37% since 2006
Today’s buyer is empowered with low mortgage interest rate loans and can spend more on their purchase without increasing their monthly budget for home payments. Additionally, the relative supply of homes for sale has reached an all-time low, allowing sellers to demand more money for their homes.
Tallahassee Median Home Value
Much like the median home price, the median home value is moving higher for two of the three property types.

Just as we saw with prices, single-family detached homes and townhomes are finding new highs while condominium units are falling in value.
Here’s how the median home value has changed since the previous market peak in 2006 and 2007:
- Single-Family Detached Homes: UP 14% since 2006
- Townhomes: DOWN 7% since 2007
- Condominiums: DOWN 34% since 2006
The market has always favored detached homes, but the disparity in the recovery in values (I believe) relates to the type of buyers in the market. Back in 2006, there was an unhealthy percentage of inorganic buyers (people who were not buying to use the property, rather they were speculating on flipping it for profit).
Plenty of buildings were converted to condominiums and the speculators had a grand old time until the market was glutted with supply and values started falling. This is clear in the graph.
Notice how townhomes are moving higher at a fairly steady pace, while the road to recovery for condominiums is much bumpier. The downtown condominium market still has a glut of supply and even the uber-popular Barrington Park condos in NE Tallahassee have fallen in value.
It seems that one result of the COVID-19 pandemic, at least for the time being, is a reduced desire for vertical urban living spaces during a time in which we are all trying to socially distance ourselves from our neighbors. It will be interesting to see how this resolves long-term as the treatments and vaccines for the virus become common.
Median Home Size
This next graph tracks the median home size by property type.

I always like to include “size” graphs whenever we study prices and values. A change in the median home size is usually the difference between what buyers are spending and what sellers are getting.
It’s common for prices and values to move at different paces. For example, if there were too many homes for sale in the market and interest rates were dropping, then we would see home prices falling due to oversupply and buyers purchasing power would increase due to cheaper money. So buyers would get more home for their money. Average home prices would rise, while average home values would decline.
Over the long haul, prices and values typically move along the same growth time, just with variances along the way. But during the short-term (like a period of 6 to 12 months), it’s very helpful to see how prices and values vary and then use the current trends to forecast the near future.
The median home size graph shows that today’s buyer is purchasing larger townhomes but smaller single-family detached homes. As townhomes have been slower in the housing market recovery thus far, buyers are getting “bigger than usual” units.
Buoyed by low mortgage interest rates, buyers have been spending more money, buying bigger homes than they could if interest rates were higher. Now, it appears as if interest rates have started moving higher. We can expect to see the median home size to continue lower as interest rates reverse direction.
The first portion of our report segmented the market by property type, but the next three graphs segment the market by age (new construction versus existing homes).
Median Home Price
This graph shows the median home price of new homes (blue), existing homes (red), and then the overall median home price (gray).

Early in 2021, we find that the median new home price has moved 4% higher than last year’s average yet only 2% higher than the average posted in 2018. Builders are obviously trying to deliver a product really close to the $300K price point.
From 2013 through 2020, the median new home price has only moved about 5% higher, an annual growth rate of less than 1%. Contrast that with the resale market which has seen the median home price move 41% higher, which is an annual growth rate of more than 5%! So resale values are rising at more than 5 times the rate of new home costs.
This means that we’re finally seeing the existing homes market close the gap between new and used homes. While this data comes from the Tallahassee real estate market, I’m hearing the same reports from Realtors all around the country. Builders have been building for just the top 10 to 15% of the market, as much of the resale market is at prices far below builder cost.
Today, the median new home price of $305K is 41% higher than the median existing-home price of $217K. Overall, the Tallahassee median home price has moved to $229K.
Median Home Value
The next graph in today’s report shows the median home value of new homes (blue), existing homes (red), and then the overall median home value (gray).

I believe the best measurement for real estate appreciation in a market with sufficient sales is the movement of the median existing-home value over time. In 2020, existing homes appreciated at 9.3%, roughly three times the average we saw in the 1990s.
Note that the builders have been holding their costs fairly steady for the past three years. I’ll be curious to see how the 75%+ increase in the minimum wage over the next four and a half years does to the cost of new homes and how that impacts the production of the homes our market so badly needs. I am not optimistic.
Go ahead and bookmark this report, and return to it in 2026. I forecast the medium (cost) value of new homes will be approaching $300 per square foot, causing the median new home price to be approaching $500K for a much smaller new home than today’s buyers are getting.
New Construction Premium
As we see existing home values rising and builders holding as steady as they can, the “premium” that a buyer pays for a new home has finally been falling. Unfortunately, this premium remains far higher than historic norms.

The graph above plots the median new home cost in red and the median existing-home value in blue (with each measured in price per square foot) for the past 30 years.
We measure the trend of the difference of the two in green and plot this percentage on the right vertical axis. This green line is something we refer to as the new construction premium, the “extra” percent that new home buyers are paying to get a brand new home.
During the 1990s, lots were fairly cheap, and so too were the sticks, bricks, and labor it took to bring a new home to the market. Thus, the median new home cost (on average) just 5% more than existing home values, though it was not uncommon to see this jump above 10% for small periods of time.
This premium jumped to more than 40% during the housing market collapse in 2006 when resale values dropped by roughly 35%. When the market finally balanced in 2016, we saw the premium reach nearly 60% (meaning a new home cost 60% more dollars per square foot than did the median existing-home).
Since that time, with builders producing fewer homes than the market demanded, we’ve seen the premium drop to just over 30%. Right now, with the market containing far too few for today’s heightened rate of demand, existing homes are appreciating so fast that we might see the premium return to the 10% level within the next 18 months.
Without considering affordability (which is a huge consideration), the return of the new construction premium to a 10% to 20% level would be all the spark builders need to go crazy as they did in 2004. However, affordability is going to be a consideration and I suspect we’ll see demand begin to cool as mortgage interest rates and home values rise.
Unlike what we saw in 2006 when cooling demand commenced in an over-supplied market, I believe the cooling demand in 2021 will begin with an under-supplied market and thus we’ll see banks reel in builders before things get out of control. Additionally, the cooling demand will make the relative supply of homes increase, helping restore traditional conditions that are not so frantic for buyers.
Median Home Size
The next graph in today’s report shows the median home size of new homes (blue), existing homes (red), and then the overall median home size (gray).

When I look at this graph, I immediately see how builders (blue bars) respond to changing market conditions. When the market was at its peak in 2006, the median home size was at its smallest. Following the market bottom in 2012, the homes in 2013 were the largest.
Simply put, when builders are struggling, they deliver more square feet for the money. And the opposite is true when times are good, the home you get for the dollar is smaller. With this in mind, I expect to see the median home size for new homes decline over the next three or more years.
Real Estate Appreciation
The final graph in this report provides a great visual of how homes are appreciating in Tallahassee.

This graph really puts some perspective on the diminished inventory of homes for sale. The market has been undersupplied since the end of 2016, and we’re really starting to see home values push higher at a faster rate.
Unless builders double their production (even more are needed) in 2021, I am forecasting double-digit appreciation (and 20% is not out of the question at this point). I am talking about hyperinflation, and it is not good. It’s nice to see home values rise, but double-digit appreciation is not sustainable and is hurting home affordability greatly.
The relative supply of homes is going to reach new lows, and the bidding wars are going to extend to more price ranges than we have seen in the past.
Some of our readers and viewers have expressed concerns about a new housing bubble, so I have embedded a video below where I addressed these concerns.
Will There Be A Housing Bubble In 2021?
Recent Housing Market Reports

Tallahassee Housing Economic Update

Tallahassee Florida Spring Economic Update
Tallahassee/US Housing Market Update Feb 2024
Which Home Sizes Are Skyrocketing In 2024?

Top 10 Neighborhoods to Live in Tallahassee for Families

Wealth Gap Widens Luxury Home Market Booms Unprecedentedly
How Bad Is It? SHOCKING Building Permits Report!

Top 10 Patio Home Neighborhoods In Tallahassee
Existing Homes Update - Tallahassee Real Estate
When moving to, in, or from Tallahassee, you will fare better if you work with a local expert. We are here to help. If you have further questions on the Tallahassee real estate market, you can leave a comment below, give us a call at (850) 366-8917, or drop us a note and we'll give you the local information needed to ensure a successful, smooth transaction.
As a local born and raised in Tallahassee with a focus on customer service, I promise you'll find great success when working with Joe Manausa Real Estate, just as have our past customers. You can read thousands of their reviews reported on Google, Facebook and Zillow right here: Real Estate Agent Reviews Tallahassee.
 Have you heard about my new book "The Business of Getting Business?" It's a comprehensive guide for small businesses to help them make the move to digital. For those of us who want to survive and thrive in a world where large corporations are taking over, it is a must-read. It's also the perfect guide for how to sell a home in the digital age. You can find The Business Of Getting Business by clicking on any of the trusted retailers below.

Think all REALTORS are alike?
Read what people are saying about working with Joe Manausa Real Estate! You can see thousands of real customer reviews reported on Google, Facebook and Zillow at this link: CLICK HERE FOR REAL ESTATE AGENT REVIEWS.
