If you want to understand the housing market right now, the biggest takeaway is simple: Tallahassee home price trends are still best read through Leon County, while smaller surrounding counties require much more caution. Leon accounts for about 70% of all 2026 sales, so it provides the clearest picture of what buyers are paying and how the market is behaving today.
That matters because not every chart tells the same story in the same way. Price trends show what buyers are paying. Value trends do a better job of showing what sellers are getting. And when lower-sales counties are included, volatility can look more dramatic than the underlying market really is. In this report, Leon is the anchor, Wakulla is the strongest secondary comparison, and the thinner-volume counties are best treated as supporting context rather than equal market signals.
Leon County Leads The Market
Before looking at individual ZIP codes or county comparisons, it helps to establish which market deserves the most interpretive weight. In the Tallahassee area, that is clearly Leon County, both because it dominates sales activity and because a larger sales base produces a more trustworthy trend line.
The chart makes one thing obvious: local housing performance is no longer moving in one uniform direction. Some ZIP codes sit well above the overall market, others continue to lag, and several outlying areas show much sharper swings. That is why broad conclusions can be misleading if they are not grounded in the dominant sales market.
For practical purposes, Leon should carry the most weight in any discussion of home prices in the Tallahassee area. Wakulla deserves attention as the second-largest comparison point, but once you move beyond those two, the odds of sample-size distortion rise quickly. In thinner-volume counties, a relatively small number of higher-priced or lower-priced closings can move the trend line more than many readers realize.
Median Home Value Growth By County
This chart matters because it shows how county-level home values have changed relative to a baseline over time. It does not show actual dollar-denominated home values or ZIP code pricing.
The key point here is that this is a relative growth chart. A county with a higher line is not necessarily more expensive. It simply means home values there have risen more from the starting point used in the index.
That is why Leon County remains the anchor for interpretation, even though its line is not the highest. Leon accounts for about 70% of 2026 sales, so it provides the strongest market signal. Wakulla is the best secondary comparison at 16% of sales. By contrast, Taylor, Jefferson, and the other lower-sales counties can show much larger swings because a small number of transactions can have an outsized effect on the trend.
This is especially important when reading Taylor’s performance on the chart. Taylor appears to have the strongest relative growth, but this should be interpreted with caution. With the fewest sales among the counties shown here, its index can look more dramatic than the underlying market really is. In plain English, this chart is best used to compare growth rates, not to decide which county has the strongest or most reliable market.
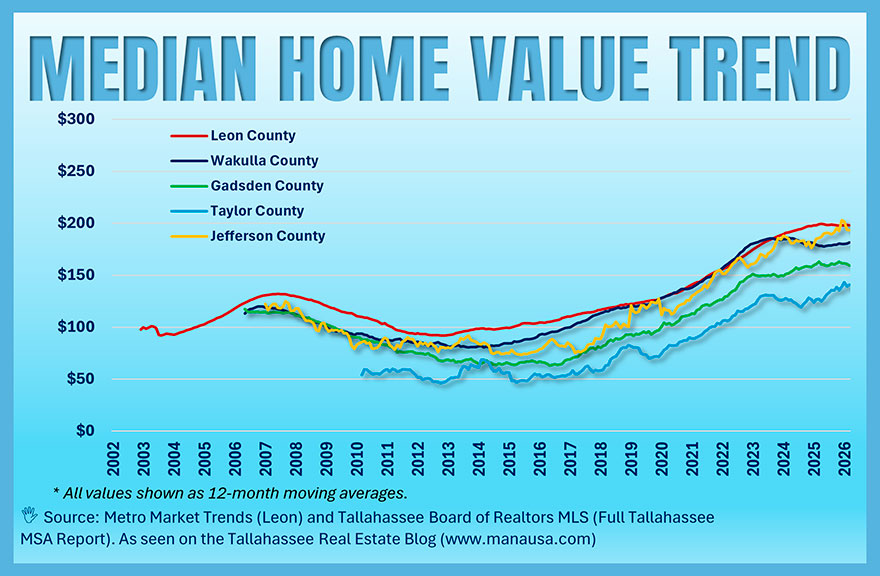
Median Home Value Trend By County
This chart matters because it shows where county home values actually sit, not just how much they have grown from a baseline. Unlike the indexed growth chart, this one helps readers compare actual value levels across counties using 12-month moving averages.
The biggest takeaway is that actual value levels tell a more grounded story than the growth chart alone. Leon remains a strong benchmark, while Wakulla and Jefferson have climbed into a similar upper range in recent years. Gadsden and Taylor remain lower in absolute value terms, even when their growth rates may look impressive on an indexed basis.
That distinction is important. A county can achieve faster appreciation from a low starting point without overtaking counties with much higher home values. In other words, Graph 2 helps show the rate of change, while this chart shows where the values really are.
This is also why values and prices should not be treated as interchangeable. Prices reflect what buyers are paying in the homes that sold. Values do a better job of showing what sellers are getting over time. When those measures diverge, the difference is often explained by changes in home size, product mix, or the types of homes selling in a given period.
For market interpretation, Leon should still carry the most weight, as it accounts for about 70% of 2026 sales. Wakulla is the strongest secondary comparison at 16%. The lower-sales counties can still offer useful context, but their trends should be interpreted more cautiously because fewer transactions can more easily distort the line.
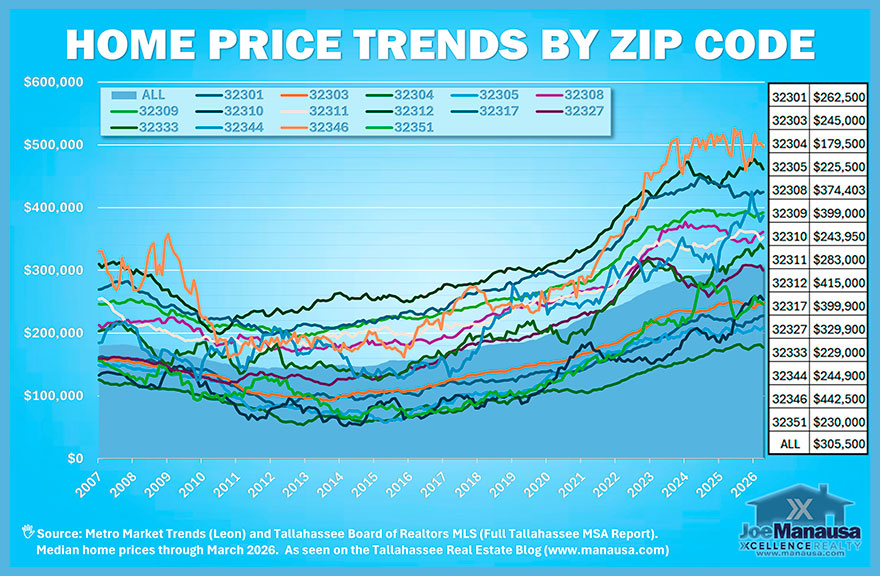
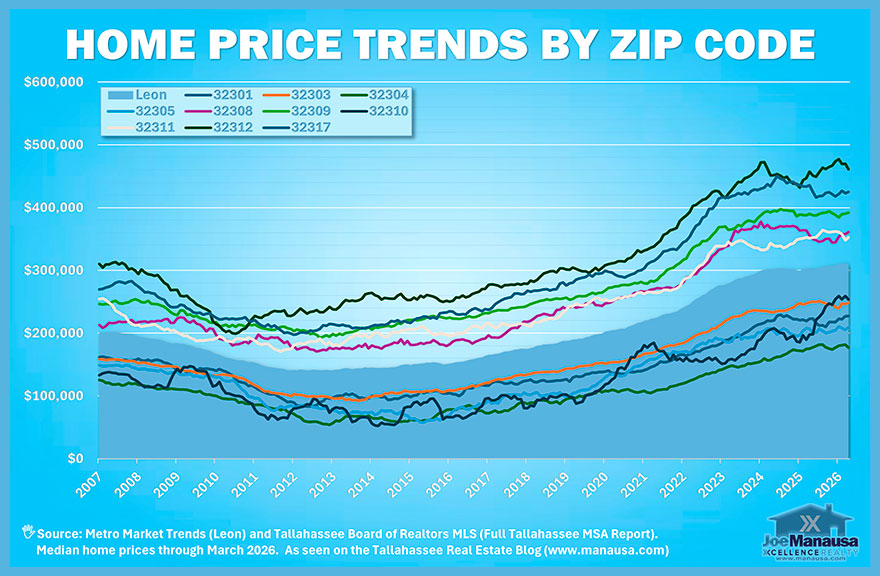
Leon County Home Price Trends By ZIP Code
This chart matters because it isolates the core market that drives most sales in the Tallahassee area. Since Leon County accounts for about 70% of 2026 sales, this is the clearest ZIP code view of where local price strength is concentrated and where affordability still sits.
The clearest takeaway is that Leon County is not one uniform market. A small group of ZIP codes has clearly separated above the county trend, led by 32312, 32309, and 32317. Those areas are operating in a different price tier from the rest of the county and have remained well above the Leon median.
Below that upper tier, ZIP codes like 32308 and 32311 form more of a middle band. They have participated in the market’s rise, but they have not reached the same pricing level as the top Leon ZIP codes. Then there is the lower tier, including 32301, 32303, 32305, 32304, and 32310, where prices remain much lower even after years of appreciation.
That structure matters because it explains why countywide averages can only tell part of the story. A homeowner in 32312 is not competing in the same pricing environment as a seller in 32304 or 32305. For buyers, this chart makes it clear that affordability still exists inside Leon County, but it is concentrated in specific ZIP codes rather than spread evenly across the market.
It also helps explain why Tallahassee home price trends can feel stronger or weaker depending on where someone is looking. The county trend is real, but the local experience of that trend depends heavily on ZIP code. In plain English, Leon County is rising, but it is rising in layers, not as one flat market.
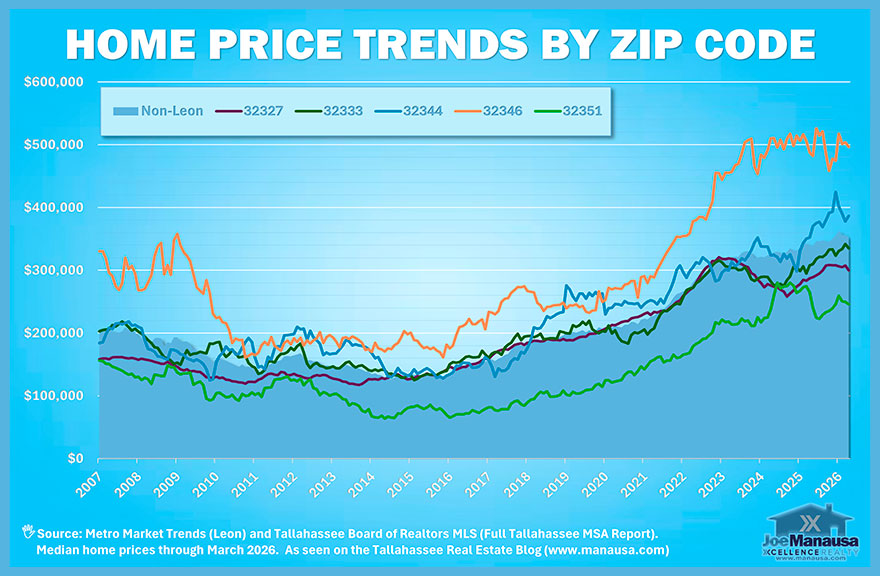
Non-Leon Home Price Trends By ZIP Code
This chart matters because it shows how the Tallahassee area’s non-Leon markets are behaving outside the region’s dominant county. It is a useful context, but it also requires more caution because these areas have far fewer sales than Leon County, so price swings can appear larger than the underlying market really is.
The clearest takeaway is that the non-Leon market is far less uniform than Leon, and far more volatile. ZIP code 32346 has clearly separated from the rest and is now priced well above the non-Leon aggregate. 32344 has also moved above the broader non-Leon line, while 32327 and 32333 sit closer to the middle of the pack. 32351 remains the lowest-priced ZIP code on this chart and has shown the weakest long-term price level.
This is exactly where sales volume matters. Wakulla County, represented here by 32327, is the most useful non-Leon comparison because it accounts for about 16% of 2026 sales, making it the only solid secondary market after Leon. By contrast, the other counties represented on this chart are much thinner markets. That means sharper rises and drops do not always signal a major shift in demand. Sometimes they simply reflect a small number of sales at different price points.
The best example is 32346, which has surged far above the rest of the non-Leon group. That is important and worth noting, but it should not be given the same interpretive weight as Leon County or even Wakulla. In a lower-sales market, a small number of higher-priced closings can dramatically shift the median. So the right way to use this chart is to spot where non-Leon pricing tiers exist, while remembering that the signal gets less reliable as sales volume falls.
What This Means For Buyers, Sellers, And Homeowners
Taken together, these charts show a market that still has support, but not in one uniform way. Tallahassee home price trends are being shaped first by Leon County, which carries about 70% of 2026 sales, and then by Wakulla, as the only strong secondary comparison. Beyond that, the lower-volume counties can provide useful context, but they should not be treated as equal signals, as a small sample size can create dramatic-looking moves.
For buyers, that means broad market headlines are only a starting point. The real question is which ZIP code tier you are shopping in. A buyer focused on 32312, 32309, or 32317 is facing a very different market from someone searching in 32304, 32305, or 32351. Even inside Leon County, affordability and pricing pressure vary sharply by location.
For sellers, the message is similar. A countywide or area-wide median may help frame the market, but it should not drive pricing strategy on its own. The most accurate pricing decisions come from comparing your home to the right local segment, especially in a market where the upper tier has pulled well ahead of many middle and lower tiers.
For homeowners, the most encouraging takeaway is that long-term appreciation remains visible across much of the region. But the charts also show why it is important to separate price trends from value trends. Prices reflect what buyers are paying for the homes that sold, while values do a better job of showing what sellers are getting over time. When those two measures do not move in perfect alignment, the reason is often sales mix, home size, or product type rather than a sudden change in true market strength.
The broader lesson is simple. Tallahassee-area home prices are not telling a neat, regional story. Leon County remains the clearest guide, Wakulla offers the strongest secondary read, and the rest of the region needs a more careful eye because volatility rises as sales volume falls. That is the best way to understand what the market is doing now, and what it likely means for your next move.
If you want help understanding where your home, your neighborhood, or your target price range fits into today’s market, the Joe Manausa Team at Xcellence Realty can help you read the local data with the context that matters most.
 Don't be the one that doesn't know what's going on when you sell a home or buy a home in Tallahassee.
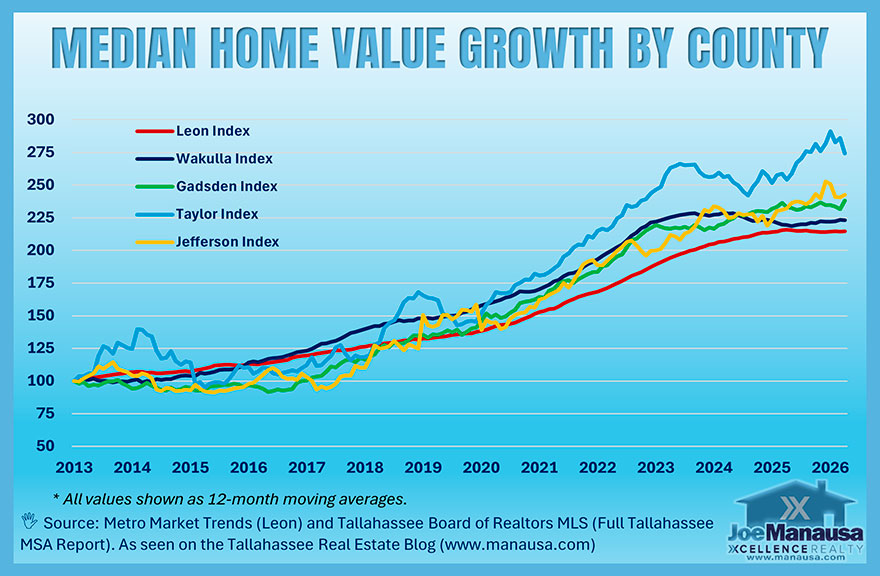


 The National Association of REALTORS conducted a survey and found that 72% of home sellers hired the first agent they interviewed.
 Have you heard about my new book "The Business of Getting Business?" It's a comprehensive guide for small businesses to help them make the move to digital. For those of us who want to survive and thrive in a world where large corporations are taking over, it is a must-read. It's also the perfect guide for how to sell a home in the digital age. You can find The Business Of Getting Business by clicking on any of the trusted retailers below.