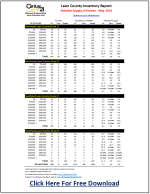
The following real estate graph and tables demonstrate housing supply and demand dynamics in the Tallahassee real estate market as of October 5, 2014. Each area of Tallahassee (Leon County, Florida) is summarized with homes for sale, homes that have sold over the past 12 months, and finally the relative supply of homes for sale (measured in “months of supply”).

| Leon County Home Inventory Report | |||||||||||||||
| Residential Supply October 2014 | |||||||||||||||
| For Sale | Sold (Past 12 Months) | Months of Supply | |||||||||||||
| PRICE RANGE | All | New | Resale | All | New | Resale | All | New | Resale | ||||||
| Northeast Leon County (Area 1) | |||||||||||||||
| $0 | – | $75,000 | 7 | 0 | 7 | 104 | 0 | 104 | 0.8 | No Sales | 0.8 | ||||
| $75,000 | – | $100,000 | 27 | 0 | 27 | 76 | 0 | 76 | 4.3 | No Sales | 4.3 | ||||
| $100,000 | – | $125,000 | 32 | 0 | 32 | 83 | 0 | 83 | 4.6 | No Sales | 4.6 | ||||
| $125,000 | – | $150,000 | 66 | 0 | 66 | 117 | 0 | 117 | 6.8 | No Sales | 6.8 | ||||
| $150,000 | – | $200,000 | 205 | 8 | 197 | 354 | 3 | 351 | 6.9 | 32.0 | 6.7 | ||||
| $200,000 | – | $250,000 | 146 | 17 | 129 | 301 | 32 | 269 | 5.8 | 6.4 | 5.8 | ||||
| $250,000 | – | $300,000 | 116 | 23 | 93 | 227 | 38 | 189 | 6.1 | 7.3 | 5.9 | ||||
| $300,000 | – | $500,000 | 196 | 29 | 167 | 287 | 48 | 239 | 8.2 | 7.3 | 8.4 | ||||
| $500,000 | – | $750,000 | 66 | 2 | 64 | 50 | 6 | 44 | 15.8 | 4.0 | 17.5 | ||||
| $750,000 | + | 36 | 0 | 36 | 20 | 1 | 19 | 21.6 | 0.0 | 22.7 | |||||
| Totals | 897 | 79 | 818 | 1619 | 128 | 1491 | 6.6 | 7.4 | 6.6 | ||||||
| Northwest Leon County (Area 2) | |||||||||||||||
| $0 | – | $75,000 | 128 | 0 | 128 | 303 | 2 | 301 | 5.1 | 0.0 | 5.1 | ||||
| $75,000 | – | $100,000 | 114 | 0 | 114 | 139 | 0 | 139 | 9.8 | No Sales | 9.8 | ||||
| $100,000 | – | $125,000 | 72 | 0 | 72 | 116 | 0 | 116 | 7.4 | No Sales | 7.4 | ||||
| $125,000 | – | $150,000 | 73 | 1 | 72 | 102 | 1 | 101 | 8.6 | 12.0 | 8.6 | ||||
| $150,000 | – | $200,000 | 91 | 5 | 86 | 116 | 16 | 100 | 9.4 | 3.8 | 10.3 | ||||
| $200,000 | – | $250,000 | 22 | 3 | 19 | 45 | 1 | 44 | 5.9 | 36.0 | 5.2 | ||||
| $250,000 | – | $300,000 | 19 | 2 | 17 | 29 | 3 | 26 | 7.9 | 8.0 | 7.8 | ||||
| $300,000 | – | $500,000 | 23 | 1 | 22 | 29 | 14 | 15 | 9.5 | 0.9 | 17.6 | ||||
| $500,000 | – | $750,000 | 6 | 0 | 6 | 3 | 0 | 3 | 24.0 | No Sales | 24.0 | ||||
| $750,000 | + | 5 | 0 | 5 | 0 | 0 | 0 | No Sales | No Sales | No Sales | |||||
| Totals | 553 | 12 | 541 | 882 | 37 | 845 | 7.5 | 3.9 | 7.7 | ||||||
| SouthEast Leon County (Area 3) | |||||||||||||||
| $0 | – | $75,000 | 39 | 0 | 39 | 117 | 0 | 117 | 4.0 | No Sales | 4.0 | ||||
| $75,000 | – | $100,000 | 34 | 0 | 34 | 49 | 0 | 49 | 8.3 | No Sales | 8.3 | ||||
| $100,000 | – | $125,000 | 22 | 0 | 22 | 64 | 2 | 62 | 4.1 | 0.0 | 4.3 | ||||
| $125,000 | – | $150,000 | 35 | 9 | 26 | 44 | 4 | 40 | 9.5 | 27.0 | 7.8 | ||||
| $150,000 | – | $200,000 | 38 | 0 | 38 | 49 | 0 | 49 | 9.3 | No Sales | 9.3 | ||||
| $200,000 | – | $250,000 | 26 | 4 | 22 | 42 | 1 | 41 | 7.4 | 48.0 | 6.4 | ||||
| $250,000 | – | $300,000 | 26 | 6 | 20 | 48 | 6 | 42 | 6.5 | 12.0 | 5.7 | ||||
| $300,000 | – | $500,000 | 31 | 3 | 28 | 55 | 9 | 46 | 6.8 | 4.0 | 7.3 | ||||
| $500,000 | – | $750,000 | 3 | 0 | 3 | 11 | 2 | 9 | 3.3 | 0.0 | 4.0 | ||||
| $750,000 | + | 3 | 0 | 3 | 2 | 0 | 2 | 18.0 | No Sales | 18.0 | |||||
| Totals | 257 | 22 | 235 | 481 | 24 | 457 | 6.4 | 11.0 | 6.2 | ||||||
| Southwest Leon County (Area 4) | |||||||||||||||
| $0 | – | $75,000 | 69 | 0 | 69 | 111 | 0 | 111 | 7.5 | No Sales | 7.5 | ||||
| $75,000 | – | $100,000 | 28 | 0 | 28 | 33 | 0 | 33 | 10.2 | No Sales | 10.2 | ||||
| $100,000 | – | $125,000 | 19 | 0 | 19 | 11 | 0 | 11 | 20.7 | No Sales | 20.7 | ||||
| $125,000 | – | $150,000 | 6 | 1 | 5 | 8 | 1 | 7 | 9.0 | 12.0 | 8.6 | ||||
| $150,000 | – | $200,000 | 11 | 2 | 9 | 10 | 1 | 9 | 13.2 | 24.0 | 12.0 | ||||
| $200,000 | – | $250,000 | 6 | 0 | 6 | 4 | 0 | 4 | 18.0 | No Sales | 18.0 | ||||
| $250,000 | – | $300,000 | 7 | 0 | 7 | 2 | 0 | 2 | 42.0 | No Sales | 42.0 | ||||
| $300,000 | – | $500,000 | 6 | 0 | 6 | 2 | 0 | 2 | 36.0 | No Sales | 36.0 | ||||
| $500,000 | – | $750,000 | 1 | 0 | 1 | 0 | 0 | 0 | No Sales | No Sales | No Sales | ||||
| $750,000 | + | 0 | 0 | 0 | 0 | 0 | 0 | No Sales | No Sales | No Sales | |||||
| Totals | 153 | 3 | 150 | 181 | 2 | 179 | 10.1 | 18.0 | 10.1 | ||||||
| All Area Totals | 1860 | 116 | 1744 | 3163 | 191 | 2972 | 7.1 | 7.3 | 7.0 | ||||||
 * Residential Properties including single family detached homes, condos, and townhouses
** Source: Tallahassee Board of REALTORS® Multiple Listing Service (Tallahassee MLS)
*** Download a copy of this in .pdf format: Tallahassee Home Inventory Report October 2014
* Residential Properties including single family detached homes, condos, and townhouses
** Source: Tallahassee Board of REALTORS® Multiple Listing Service (Tallahassee MLS)
*** Download a copy of this in .pdf format: Tallahassee Home Inventory Report October 2014