Summary
Cash buyers now take close to three of every ten homes sold in Leon County, and cash buyers have held that kind of share for more than a decade. It is the biggest change in Leon County housing market trends in thirty five years. For seventeen straight years before 2008, that share never once moved outside a narrow band between about 13% and 17%. It has not returned to that band since.
Here is what thirty-five years of Leon County residential sales show:
- The cash share ran between about 13% and 17% every year from 1991 through 2007, averaging just under 15%.
- It climbed for six straight years, peaked at 40.6% in 2014, and stands at 27.9% this year.
- Cash buyers roughly doubled in number, from 367 in 1991 to 724 this year.
- Financed purchases fell from a peak of 4,444 in 2005 to 1,875 this year.
- Adjustable-rate loans reached a third of financed purchases in 2005 and piggyback seconds nearly three in ten in 2006. Both are back near 6% today.
- Cash buyers take 45.6% of the least costly quarter of the market and 26.7% of the most costly, and every price group has roughly doubled since 2007.
- Of every 100 entry level homes sold today, 38 go to someone who will live in them, down from 48 before the crash.
That last point matters more than the headline. Tallahassee did not fill up with wealthy buyers. The bottom of the market lost the loans that used to serve it, and cash moved into the space those loans left behind. If you are weighing a move, cash buyers change what you should expect from the homes for sale in Leon County and from the offers you receive on your own.
Are More Buyers Paying Cash?
The plainest way to read a market is to watch a number that used to sit still. The share of Leon County residential sales going to cash buyers held steady for seventeen years, then broke out of its range and stayed out.
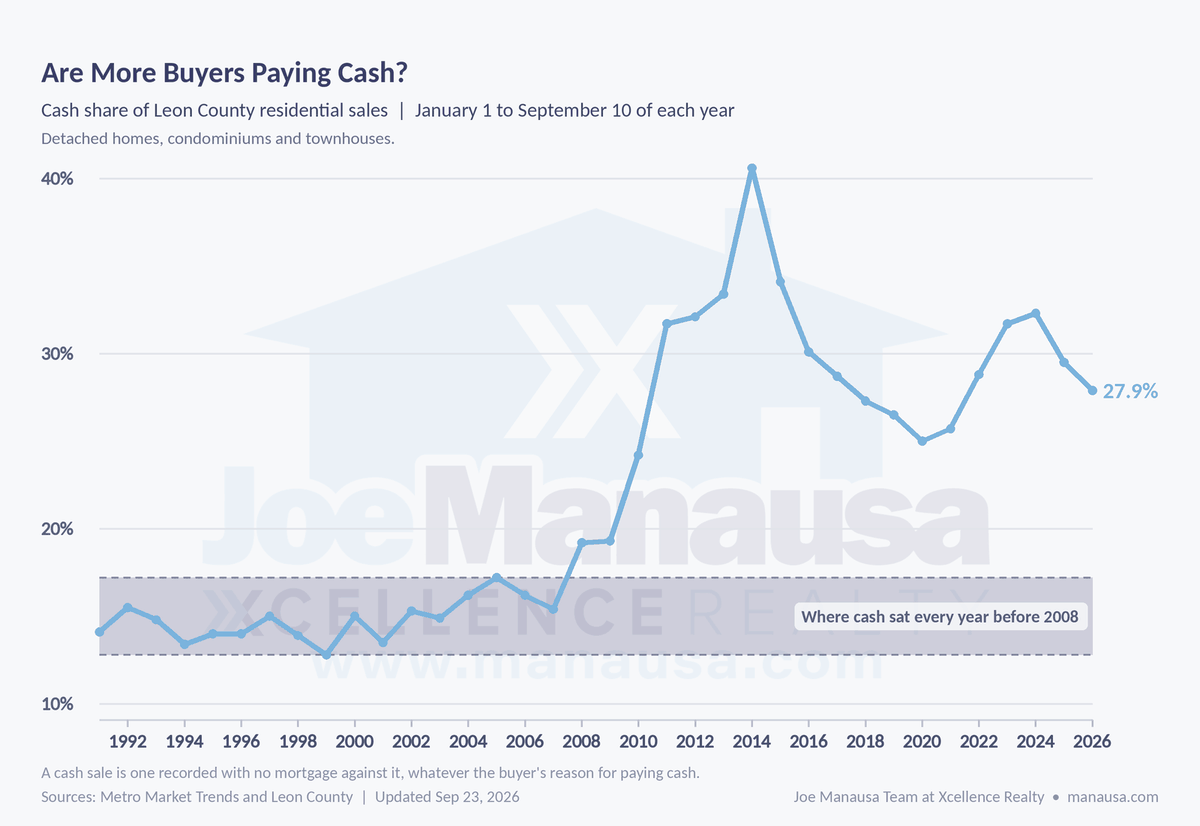
The shaded band marks where cash buyers sat every year from 1991 through 2007. Through a recession, a refinancing boom and the entire run-up to the housing bubble, the share never left it. The band is narrow on purpose: four and a half percentage points covers every one of those seventeen years.
Then it climbed every year from 2008 to 2014, from 19.2% to 40.6%. Six consecutive years of movement in one direction is not noise, and no stretch anywhere else in the series looks like it.
What followed is the part most people miss. The share came down from its peak, but it settled near 28%, not back near 15%. Twelve years have passed since 2014, long enough to call this a new level rather than a spike still working its way out. For anyone following Leon County housing market trends, this is the structural change sitting underneath the monthly numbers.
How Many Buyers Borrow, and How Many Pay Cash?
A share can rise two ways. Cash buyers can grow in number, or borrowers can shrink. Counting the two groups separately settles which one happened here, and a percentage alone cannot do that.
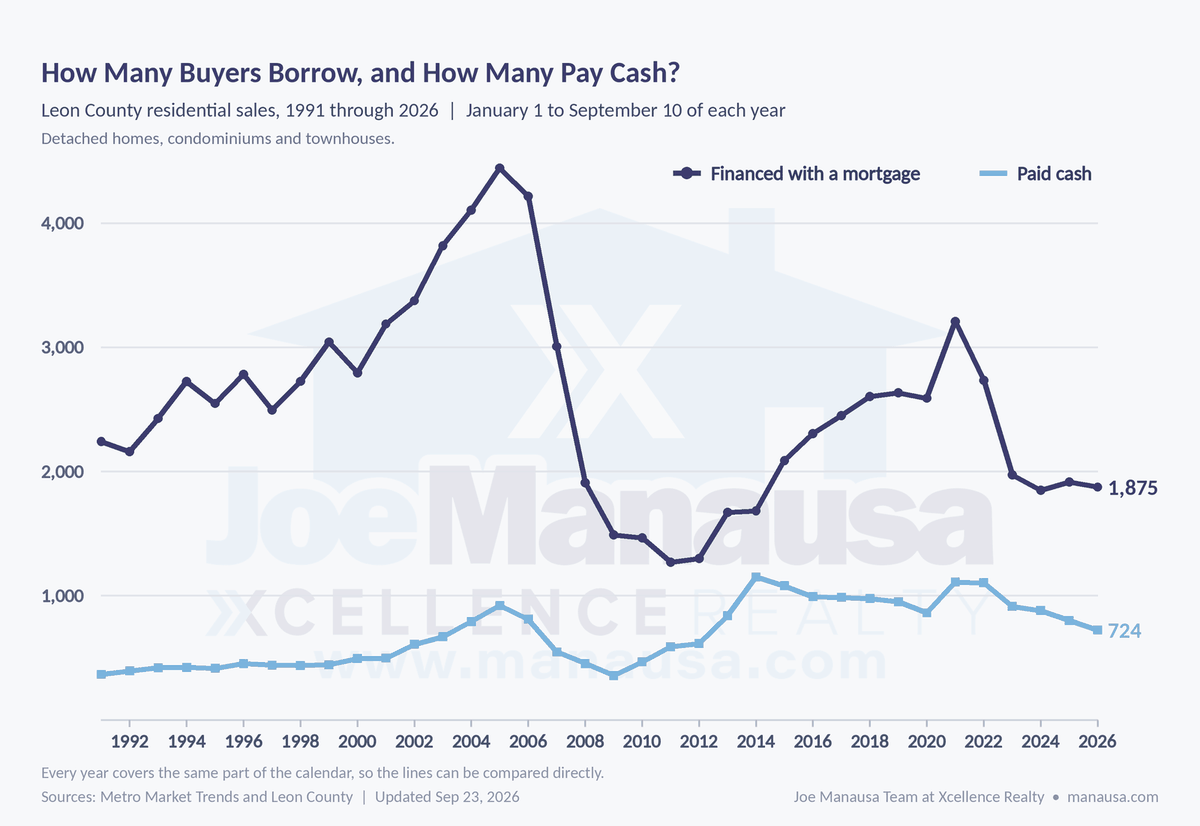
Both happened, and the second happened harder. Cash buyers roughly doubled across thirty-five years, from 367 to 724. Financed purchases went the other way, from 2,241 in 1991 to 1,875 this year, after peaking at 4,444 in 2005.
Measured against the 1991 through 2007 average, cash buyers are up 70% and financed purchases are down 32%. Both forces are real and they are close in size, with the loss of borrowing slightly the larger of the two.
The total is worth seeing on its own. Leon County closed 5,365 residential sales in the 2005 window and 2,599 in the same window this year. The market is roughly half the size it was at its peak, and almost all of that loss is financed buyers.
Losing financed buyers did not leave the market awash in homes. Leon County is carrying about four months of supply, a level that in any earlier decade would have been called a seller’s market. Roughly seven in ten buyers here sell a home in order to buy one, so every buyer the market loses is a seller it never gets. That is why inventory has stayed tight even as sales fell by half.
Do Landlords and Homeowners Pay Cash Alike?
The usual explanation for all this is that investors took over after the crash and never left. That is testable, because the records show whether the buyer’s mailing address is the property itself.
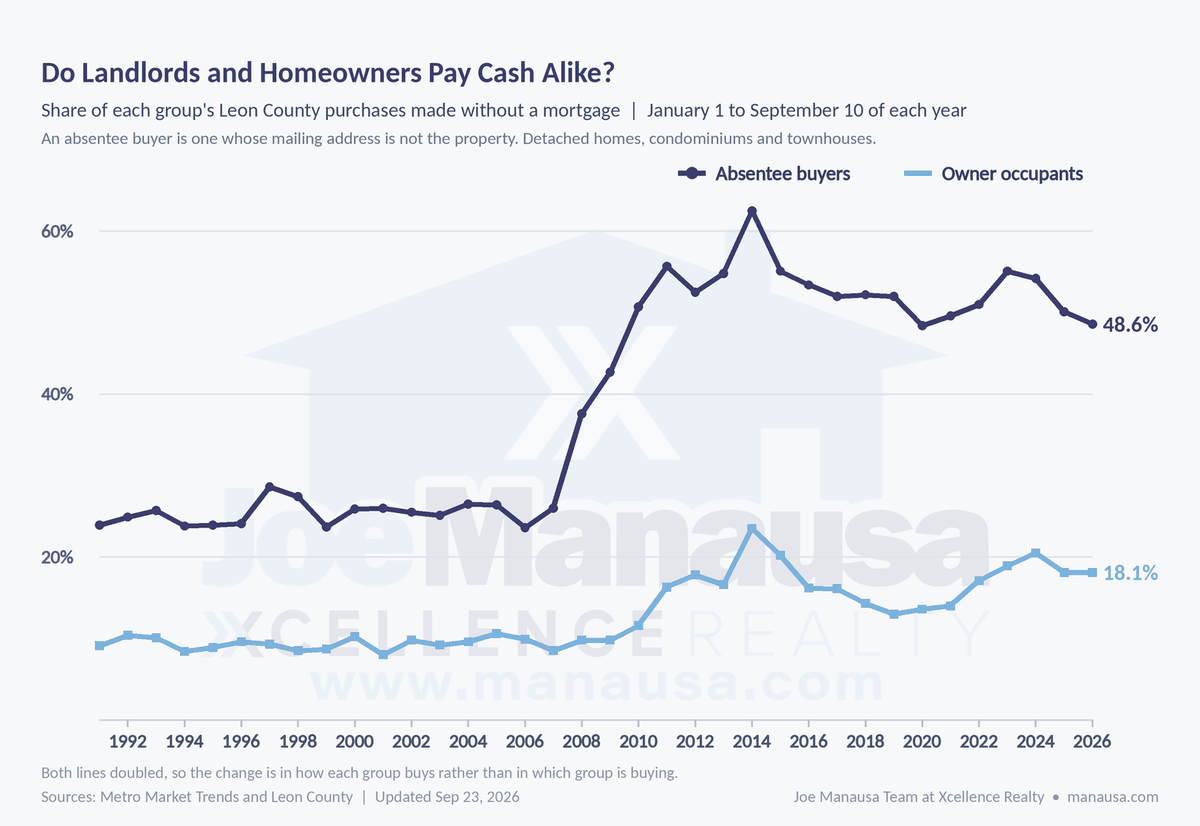
Absentee buyers did shift hard toward cash. Before 2008, about one in four of them bought without a mortgage. Since 2010, it has been closer to one in two.
But owner occupants did exactly the same thing on a smaller scale. They bought without a mortgage about one time in eleven before 2008, and now closer to one time in five. Both groups roughly doubled.
That is the part that settles the argument. Absentee buyers are 34.5% of sales today against 34.8% in the 1991 through 2007 era, so the share of the market they take has not changed at all. Cash buyers did not crowd anyone out. The same mix of people is buying, and within every group about twice as many are now cash buyers.
Which means the cause sits with financing rather than with who is shopping, and it is the same story the market has been telling since it moved from distress to friction. The next two graphs show which loans left.
What Kinds of Loans Went Away?
If borrowing fell, the useful question is which loans stopped being written. Two products carry most of the story, and both were at their peak in the years right before the market turned.

Adjustable-rate loans climbed to a third of financed purchases by 2005, and piggyback seconds to nearly three in ten by 2006. Both fell away after 2007, and adjustable rates sit near 5% this year. Rate type is only recorded in these records from 2002 and is incomplete in a few later years, so that line starts in 2003 and breaks where the record thins.
The piggyback line is the more interesting one, because it never actually went away. Piggybacks ran between about 4% and 11% right through the 1990s, spiked to nearly three in ten at the peak, and sit near 6% today, back inside their old range. This is a product Leon County used steadily for decades without trouble, in the same price range where cash buyers are now most common.
We went looking for a change in how these loans were built and did not find one. A piggyback here has almost always been a way to buy with nothing down. The combined first and second ran right at 100% of the price through the 1990s, and the median today is 102.7%, which is a zero down loan with costs rolled in. The bubble years did not invent a riskier structure. They wrote the same structure far more often, for far more buyers.
So the entry path did not narrow because a loan type was taken off the table. It narrowed because low down payment lending fell back toward its old volume while prices did not fall back to their old level. That is a harder problem than a banned product, because there is nothing to put back.
Are Buyers Still Using FHA and VA Loans?
FHA and VA loans ask the least money down of any common program, so their share is a fair read on whether buyers with modest savings can still compete. Their history in Leon County is more turbulent than most people expect.
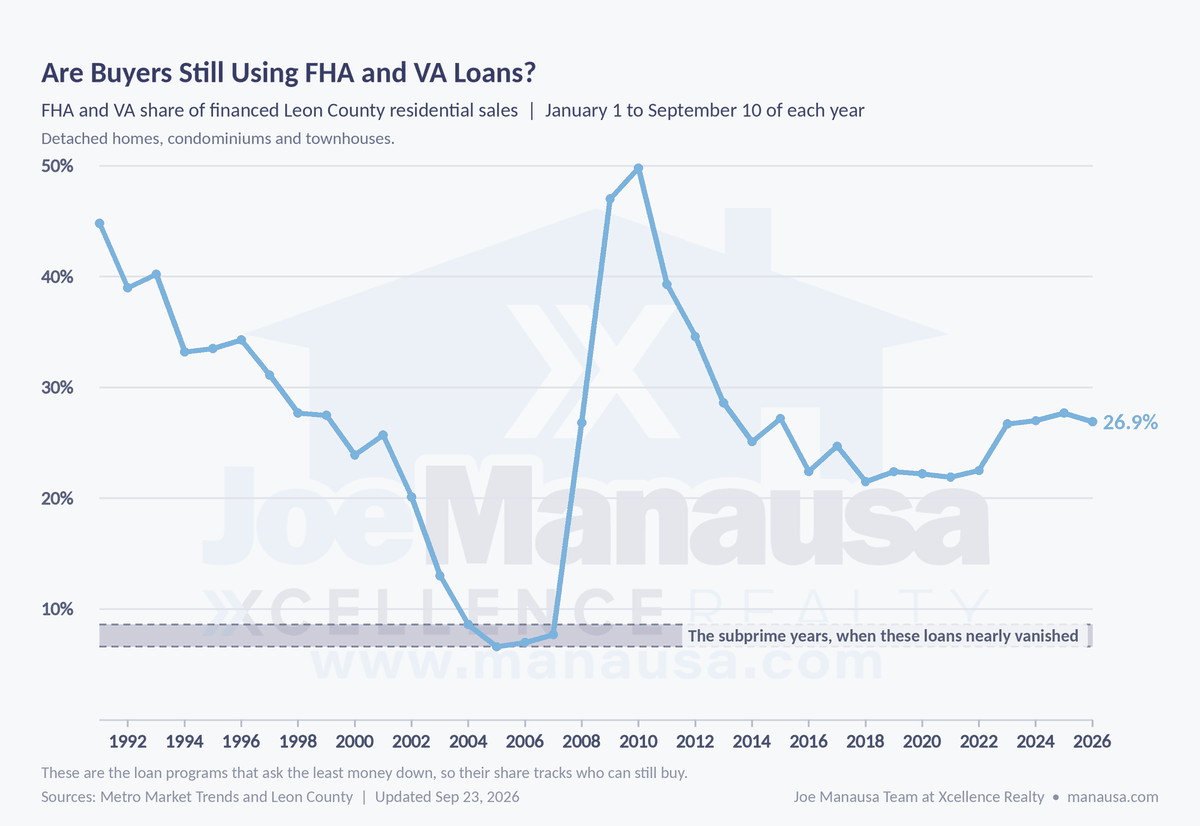
These programs carried nearly 45% of financed purchases in 1991. They fell below 7% by 2005, shown in the shaded band, then surged back to almost 50% in 2010. That is a sharper swing than anything cash buyers did over the same years.
Buyers did not cause it by changing their minds. FHA and VA were undercut by products that asked even less at closing. Conventional lending took more than 90% of financed purchases in 2005, adjustable rates reached a third, and piggyback seconds a quarter.
A piggyback let a buyer in with nothing down and no mortgage insurance premium, and it closed faster than an FHA file. A 2006 Mortgage Bankers Association survey found the same three reasons nationally: looser conventional and subprime underwriting, no zero down payment product at FHA, and higher FHA origination costs. FHA loan limits made it worse, capped at 95% of the county median while prices ran ahead of them.
Then the products that displaced them stopped being written. By 2010 adjustable rates were under 3% of financed purchases and conventional lending had fallen to about 46%. FHA was the low down payment channel still standing, and cash buyers were taking a rising share of what was left.
Congress widened it, lifting the loan limit floor to 271,050 dollars for 2009 against a 362,790 dollar maximum before the 2008 stimulus. Nationally FHA went from about 3% of purchase mortgages in late 2006 to roughly one in four by the end of 2008. Leon County ran the same course, only further, and cash buyers took the entry level ground while it happened.
They have since settled near 27%, which is close to their weight in the mid 1990s. So the low down payment channel did not vanish. It was crowded out, it came back, and it found a normal level.
What did not come back is the overall volume of financed purchases. That is the difference between a channel recovering and a market recovering, and it is why affordability keeps blocking sales even in years when rates ease.
Which Homes Do Cash Buyers Buy?
If cash buyers had arrived because Tallahassee grew wealthier, they would show up at the top of the market. Sorting every year’s sales into four equal price groups tests that directly, and the groups move with the market rather than sitting at fixed dollar amounts.

Cash buyers take 45.6% of the least costly quarter of the market and 26.7% of the most costly. The bottom of the market is where cash buyers concentrate, and it is not close.
The comparison against the earlier era is the one that surprised us. From 1991 through 2007 the four groups ran 23.8%, 11.0%, 11.3% and 13.4%. Every one of them has roughly doubled since. Cash buyers did not single out the bottom of the market. Cash buyers rose in every price group at once, and the bottom simply started higher and stayed highest.
That agrees with what the absentee graph showed. Landlords and owner occupants both doubled their cash rate, and so did every price group. A change that turns up in every corner of the market at the same time is telling you about the financing, not about one kind of buyer.
Where the bottom of the market really is different is in who ends up living in the house. Of every 100 entry level homes sold in Leon County today, 38 go to someone who will live in them. In the 1991 through 2007 era it was 48. Investors are more active in the bottom quarter than they used to be, and a buyer shopping there today runs into cash buyers far more often than a buyer did a generation ago. That is the pressure the income needed to buy a home keeps adding to first time buyers.
What This Means If You Are Selling
A seller at the lower end of the Leon County market faces a different pool of buyers than a seller above the median. Knowing which pool is looking at your home changes how you price it and how you read an offer.
Below the county median, about one buyer in three is a cash buyer. That is double the rate of the earlier era. A financed offer is still the most likely offer you will see, but it is no longer the overwhelming favorite it once was, so expect a wider spread in how your offers are built than a seller would have seen ten years ago.
Above the median, three in four buyers still borrow. Rates, appraisals and loan conditions still set your timeline there, and a buyer’s financing is still the most common reason a contract falls apart.
Both pools are smaller than they were in 2005. That is the honest backdrop to choosing when to sell and to how long homes are taking to sell right now. Pricing against last year’s expectations is the most expensive mistake available in this market.
What Could Your Home Sell For?
Where your home sits against the county median decides which of those two buyer pools you are selling into. This tool gives you a current value estimate from recent nearby sales, which is the number that tells you which side of the line you are on.
Once you know roughly where you stand, the pricing conversation becomes a much shorter one.
What This Means If You Are Buying
Buyers using FHA or VA financing are competing hardest in the exact part of the market where cash buyers are most common. That is a real disadvantage, and it is better planned around than discovered at the offer stage.
It cuts the other way above the median, where cash buyers are far less common and a well-prepared financed offer is closer to the norm. Looking a little higher, or in a neighborhood where supply favors buyers, can put you in a pool where your financing is not the thing that sets you apart.
The new construction market is worth a look for the same reason, since builders sell to financed buyers as a matter of course. A wider search across Tallahassee neighborhoods and the current Leon County homes for sale will show you where the competition thins out.
Frequently Asked Questions
Does a cash offer always beat a financed offer? No. A cash offer removes the lender from the transaction, which usually means fewer conditions and a shorter close, and that is worth something to a seller. Price, timing and the condition of the contract still decide most sales.
Are cash buyers mostly investors? At the entry level, yes. Of the homes in the least costly quarter bought without a mortgage, four in five went to a buyer whose mailing address is somewhere else. Among buyers who used a mortgage in that same quarter, fewer than half were absentee. The records cannot tell us why any individual paid cash, but they do show who moved in, and at the bottom of the market the cash buyer usually did not.
Is 27.9% a lot by national standards? It is high relative to Leon County’s own history, which is the comparison that matters for pricing a home here. National cash shares are reported by Redfin and others on different definitions, so we do not treat them as interchangeable with these records.
Will the cash share come back down? It fell from 40.6% in 2014 to 23.8% in 2020, then rose again. The one thing twelve years of data argue against is a return to the pre-2008 band without the return of low down payment lending volume.
Keep Up With the Local Market
We publish this kind of analysis every week, built from the same records rather than from national headlines. Subscribe and it arrives before you need it.
How We Measured This
Every figure above covers Leon County residential sales, meaning detached homes, condominiums and townhouses. Each year is measured over the same calendar window, January 1 through September 10, so a partial 2026 is never compared against a full earlier year.
A cash sale is one recorded with no mortgage against it. We do not know why any individual buyer paid cash, and these numbers do not claim to. What they show is how often it happens, and where in the market it happens most.
We Are Here To Help
If you are weighing a move, the useful next step is a conversation about your specific home and price range, not a general read on the county. We are glad to have it, whether you are ready this month or next year.
Drop us a note and tell us what you are considering. You can also read more about selling a home in Tallahassee, buying a home here, or our team.
Sources
Sales and financing records come from Metro Market Trends and the Leon County Property Appraiser, with listing detail from the Tallahassee Board of REALTORS. For national context on mortgage rates and lending we follow the 30-year fixed rate series at FRED, the Freddie Mac Primary Mortgage Market Survey, Census housing vacancies and homeownership, and Zillow’s housing data.