
Summary
Tallahassee Area ZIP Codes tell two different housing-market stories: some favor buyers, while others favor sellers. The regional market is close to balanced overall, yet the negotiating room changes sharply from one ZIP code to the next. That difference matters more than any single citywide average.
Through August, Tallahassee MSA home sales are running near 3,100, and the latest year-over-year reading is down 9.4%. Leon County has more homes for sale than it did during the past several years, but inventory remains far below the levels seen during the last major housing downturn. Meanwhile, the average 30-year fixed mortgage rate reached 6.71% on September 3. That is expensive compared with the ultra-low rates buyers remember, but about 12.6% below the 50-year average of 7.68%.
The practical lesson is simple: buyers and sellers should make decisions from the conditions in the specific ZIP code, price range, and property type they are targeting. Our continuing Tallahassee real estate analysis can help you follow the broader market, but this report explains why local supply deserves the closest attention right now.
Key Takeaways
- The broad market looks balanced. Total Tallahassee-area supply is near five months, inside the four-to-six-month market-balance range shown in the ZIP-code graph.
- The local market is divided. ZIP codes such as 32308, 32309, and 32312 favor sellers, while 32305, 32346, and 32351 give buyers far more choice.
- Sales remain restrained. Year-to-date activity is near the current comparison level, but the latest year-over-year sales reading remains negative.
- Inventory has recovered without returning to crisis levels. Leon County listings have risen from recent lows but remain well below the late-2000s peak.
- Mortgage rates still limit purchasing power. The current rate is below its 50-year average, but it remains high enough to make payment planning essential.
Home Sales Are Holding Near Today’s Reduced Pace
We begin with the broadest local measure. The first graph compares Tallahassee MSA home sales through August of every year since 2003. The MSA view includes Leon, Jefferson, Gadsden, Wakulla, and surrounding areas, so it should not be read as a Leon County-only result.
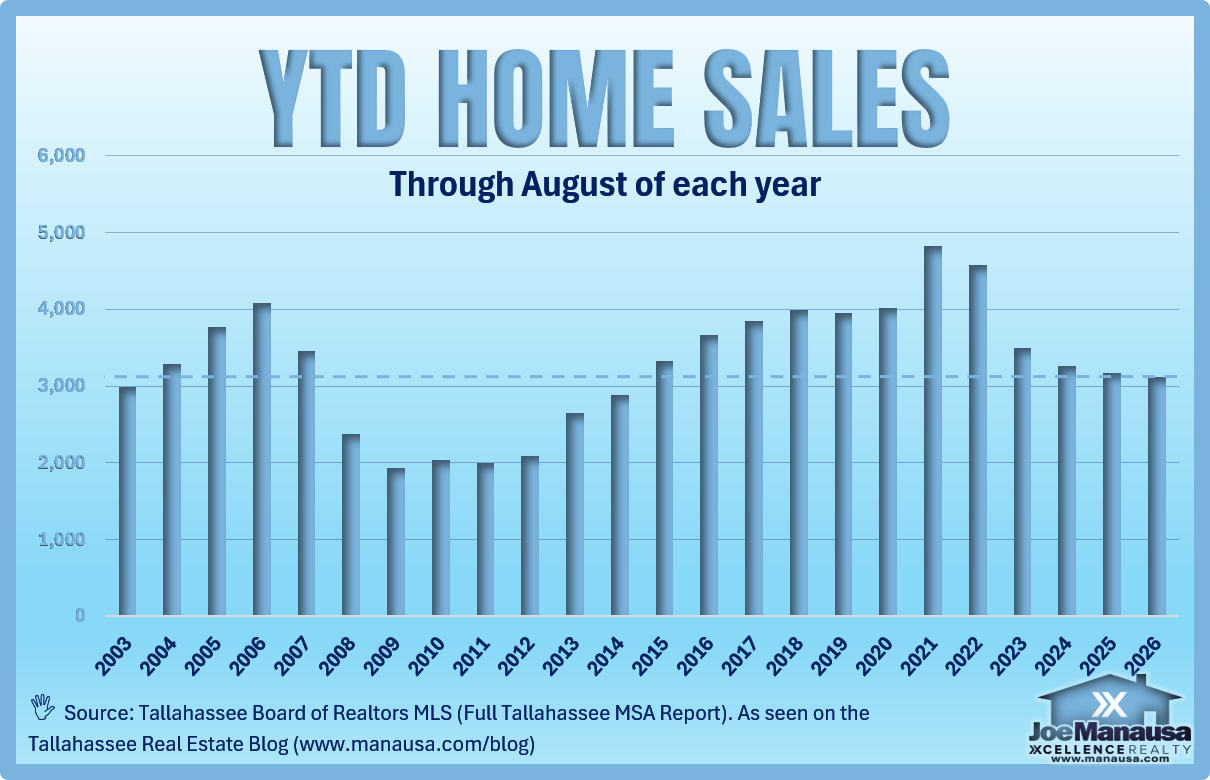
The dashed line is not a historical average. It extends the current 2026 sales level backward so you can quickly see which prior years were stronger or weaker than today. Most years from 2015 through 2024 finished August above the present pace, with 2021 and 2022 standing well above it. The current total is much closer to the low-activity range seen during weaker portions of the last two decades.
That does not mean the market is frozen. Thousands of homes are still changing hands, and the right property can move quickly. It does mean buyers have become more selective and sellers cannot assume that the demand conditions of 2021 will return simply because a home is listed. People comparing locations can use our Tallahassee communities and neighborhood guides and the evergreen guide to choosing the best Tallahassee neighborhood to narrow the search before evaluating current supply.
Home Sales Have Fallen for Three Straight Months
Tallahassee MSA home sales have now fallen below the prior year for three consecutive months. Sales dropped 6.5% in June, 16.1% in July, and 9.4% in August compared with the same months one year earlier. That is no longer a single weak month. It is a clear short-term trend of fewer completed sales.
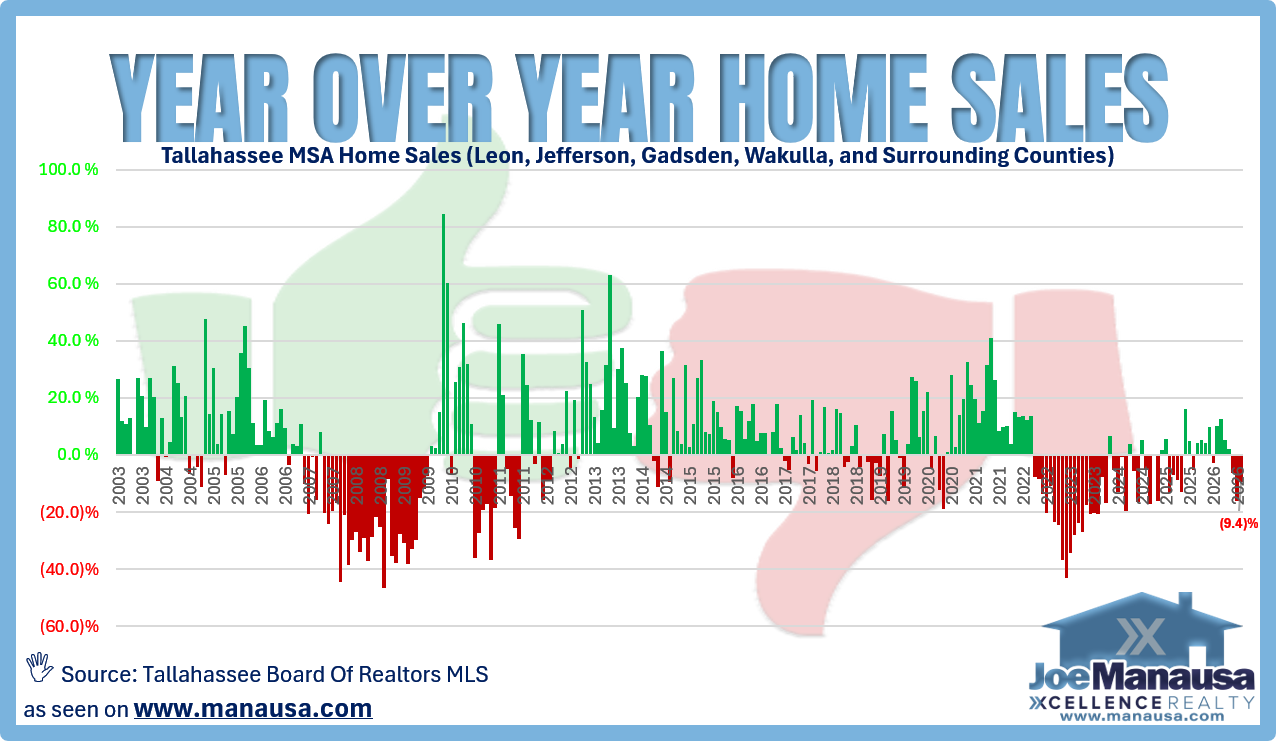
For sellers, three weaker months mean it is risky to price a home as though buyer demand were still rising. For buyers, fewer sales may create more negotiating room, but only where enough comparable homes are available. The trend matters, but it does not mean every neighborhood or price range is moving in the same direction.
Sales volume also does not tell us what prices are doing or who has leverage in a particular neighborhood. That is why this comparison of Tallahassee area ZIP codes matters. Buyers who are ready to act can review the home-buying process, create a focused search through our Home Finder, and watch newly listed homes.
Leon County Inventory Has Rebuilt From Recent Lows
Sales tell us how many transactions are occurring. Inventory tells us how much choice is available. This graph narrows the geography to Leon County and compares the number of homes for sale at the start of September in each year since 2008.
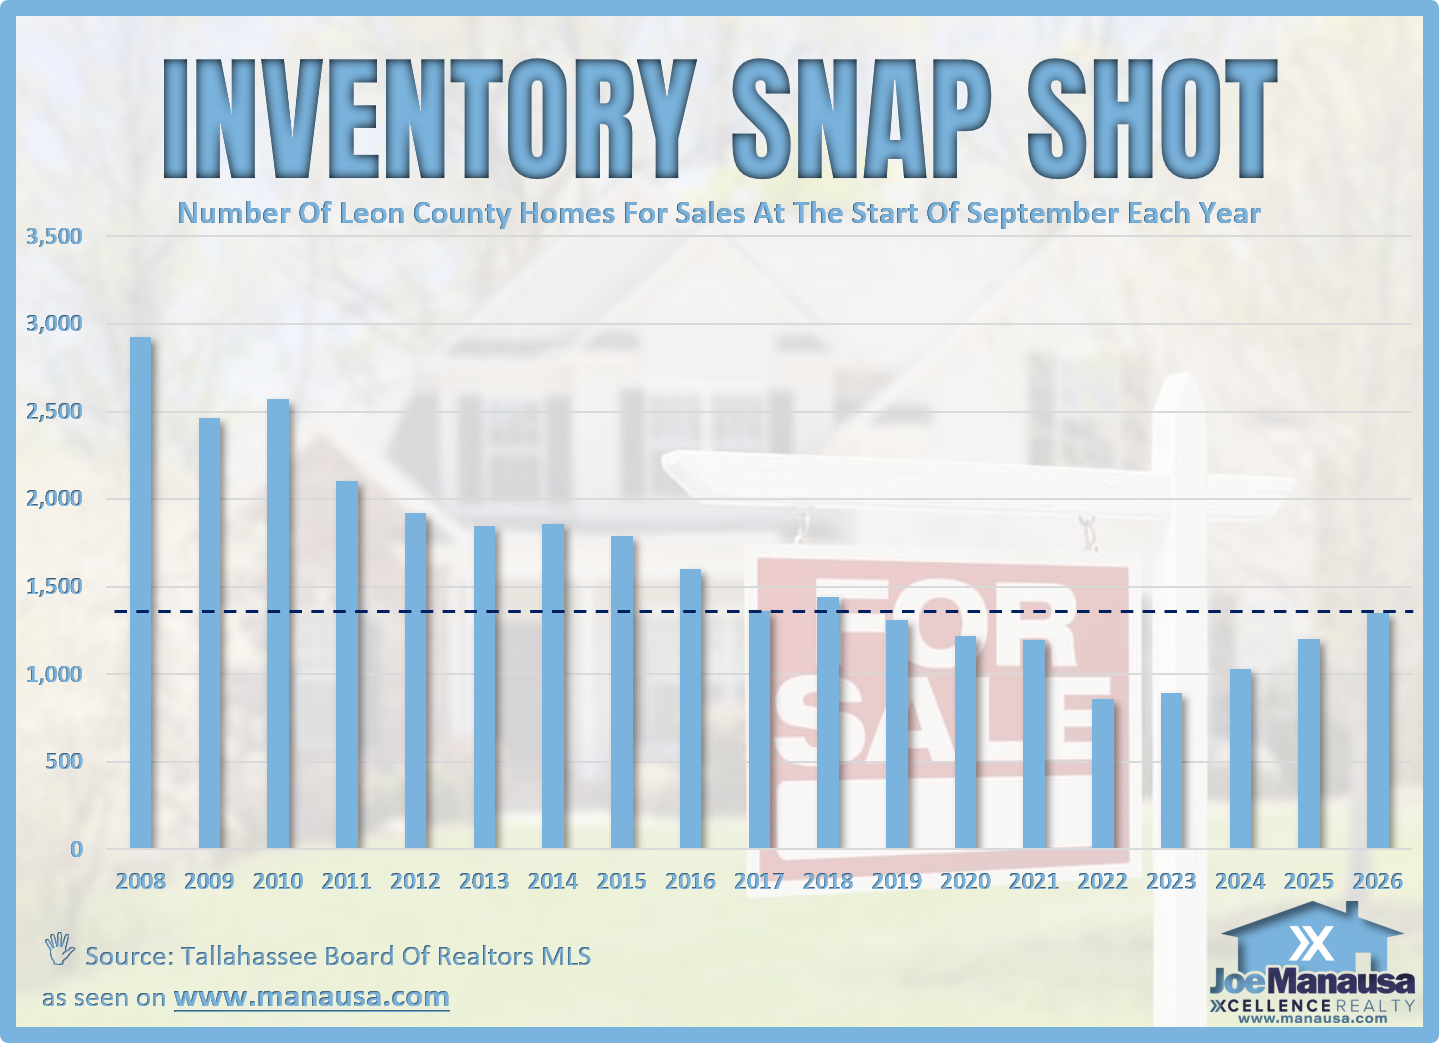
The 2026 inventory bar is higher than every September reading since 2018. That is a meaningful improvement in choice for many buyers and a clear change from the extreme scarcity that defined the pandemic-era market. Still, today’s supply is less than half the level recorded in 2008. Calling the current market “another 2008” would ignore that scale difference.
Countywide inventory also cannot tell you what is happening in a particular ZIP code or price segment. A buyer may find several competing listings in one area and almost none in another. A seller may face limited competition at one price and a crowded field just above it. Owners considering a move should start with a property-specific home-value evaluation, because county inventory does not replace recent comparable sales, condition, location, or buyer response.
What Tallahassee Area ZIP Codes Tell Us About Housing Supply
This is the graph that explains the apparent contradiction. Months of supply divides active listings by the current monthly sales pace in each ZIP code. The shaded four-to-six-month band represents approximate market balance. Below that range, sellers generally have more leverage. Above it, buyers generally have more options and more room to negotiate.
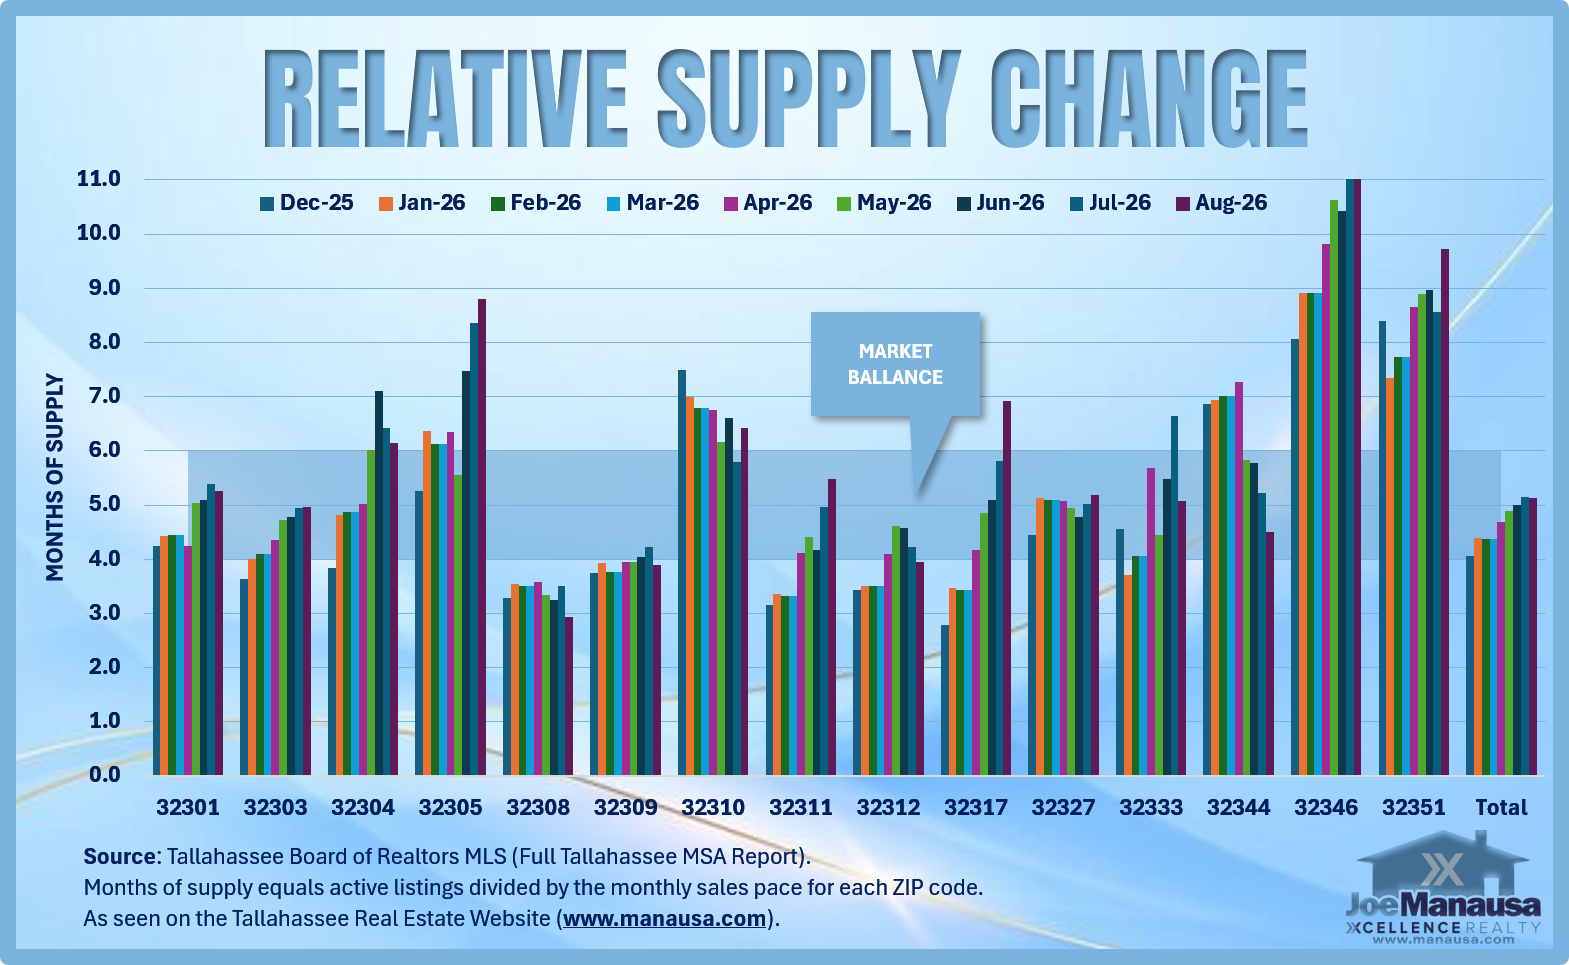
The total market is near five months of supply, which appears balanced. Inside that average, conditions spread from less than three months in 32308 to roughly eleven months in 32346. ZIP codes 32309 and 32312 also sit below four months, giving sellers a relative advantage. At the other end, 32305 and 32351 carry close to nine or more months of supply, while 32304, 32310, and 32317 are above the balance range.
The divergence has widened over the months shown. Some ZIP codes moved toward tighter seller conditions while others accumulated supply and moved further into buyer territory. This is why a headline declaring that Tallahassee is simply a buyer’s market or a seller’s market would be incomplete. The most useful answer begins with location, then narrows further to price range and property type. For a general reference, see our Tallahassee ZIP code guide.
The graph also has limits. ZIP codes contain different mixes of housing, and smaller areas can produce more volatile readings when sales counts are low. Months of supply describes the relationship between listings and the recent sales pace. It does not guarantee that every seller in a low-supply ZIP code will receive multiple offers, or that every buyer in a high-supply ZIP code will secure a large discount. For broader price context, the Federal Housing Finance Agency’s House Price Index offers ZIP-level and metro-level tools, but those price indexes measure something different from the local supply relationship shown here.
Mortgage Rates Are High, But Not High by Long-Term Standards
Financing remains one of the main constraints on transaction volume. The final graph follows the national conventional conforming 30-year fixed mortgage rate from 2021 through September 3, 2026.

Freddie Mac’s Primary Mortgage Market Survey reported a 6.71% average on September 3. That is about 12.6% below the 50-year average of 7.68%, even though it feels high after the unusually low rates of 2020 and 2021. The Federal Reserve’s historical mortgage-rate series provides another useful view of that long-term context.
The long-term comparison should not minimize the payment challenge. A buyer’s actual offer depends on credit, down payment, loan type, points, and lender pricing. Principal and interest also understate the full cost of ownership. Property taxes, homeowners insurance, mortgage insurance, association fees, maintenance, and utilities can materially change the monthly budget. The Consumer Financial Protection Bureau’s affordability guidance and its Loan Estimate explainer help buyers compare those costs.
Locally, our mortgage calculator and affordability calculator can turn a price and rate into a starting estimate. Florida buyers should also review homeowners-insurance resources from the Florida Office of Insurance Regulation. Leon County buyers and owners can research assessments, exemptions, and estimated taxes through the Leon County Property Appraiser.
What Buyers and Sellers Should Do With This Information
For Buyers
Start with the ZIP code, but do not stop there. Compare the current competition among homes that truly fit your budget and needs. In a high-supply area, you may have time to compare properties, request repairs, or negotiate price and terms. In a low-supply area, preparation matters more. A strong preapproval, a clear decision process, and realistic expectations can protect you from losing the right home while you are still analyzing the regional average.
These Tallahassee area ZIP codes show where patience may create leverage and where a well-prepared offer may matter more.
First-time buyers can use our first-time home-buying guide to prepare for the process. The goal is not to rush. It is to know which parts of the market reward patience and which require decisive action.
For Sellers
Do not price from a broad Tallahassee headline. A seller in a low-supply ZIP code may have less direct competition, but buyers still compare condition, updates, presentation, and monthly cost. A seller in a high-supply ZIP code needs an even sharper launch because buyers can reject an overpriced listing and move to the next option.
Our guide to selling a home successfully, the evergreen rules of seller home pricing, and our real estate marketing plan explain why positioning must match the competitive set from the first day on the market.
What Could Your Home Sell For?
Your ZIP code is only the starting point. Get a home-value estimate based on your property and current market conditions.
Frequently Asked Questions
Is the Tallahassee area currently a buyer’s market or a seller’s market?
The total market is close to balanced at roughly five months of supply. Individual ZIP codes differ sharply, so some favor buyers while others still favor sellers.
Why do Tallahassee area ZIP codes show such different levels of housing supply?
Each ZIP code has a different combination of active listings, sales pace, price points, property types, and buyer demand. Smaller sales samples can also make monthly changes look more dramatic.
Does more inventory mean Tallahassee home prices will fall?
Not necessarily. Inventory is one important factor, but price movement also depends on demand, property condition, location, financing, and the balance within a specific competitive segment. This report does not use a price graph to forecast a decline.
Are mortgage rates above their historical average?
No. The September 3 average of 6.71% is about 12.6% below the 50-year average of 7.68%. It is still high enough to limit purchasing power compared with the ultra-low rates seen earlier this decade.
Final Takeaway
Tallahassee area ZIP codes show why a broad market average can mislead. Regional sales are subdued, Leon County inventory has recovered, and mortgage rates continue to pressure affordability. Yet the negotiating environment changes materially from one ZIP code to the next.
Buyers should identify where added supply creates opportunity without assuming every seller must negotiate. Sellers should measure their actual competition without assuming a low-supply ZIP code guarantees an easy sale. The best strategy is local, current, and specific to the property.
We Are Here To Help
If you are planning a move, the Joe Manausa Team at Xcellence Realty can help you translate these market differences into a practical buying or selling strategy. Drop Joe a note and tell us which ZIP code, price range, or property you are considering.