
Keep Up With New Trends In Tallahassee!
Get The Tallahassee Real Estate Newsletter
 Don't be the one that doesn't know what's going on when you sell a home or buy a home in Tallahassee.
Other buyers, sellers, lenders, and real estate agents have this critical information, and now you can too!
Get immediate access to our most recent newsletter.
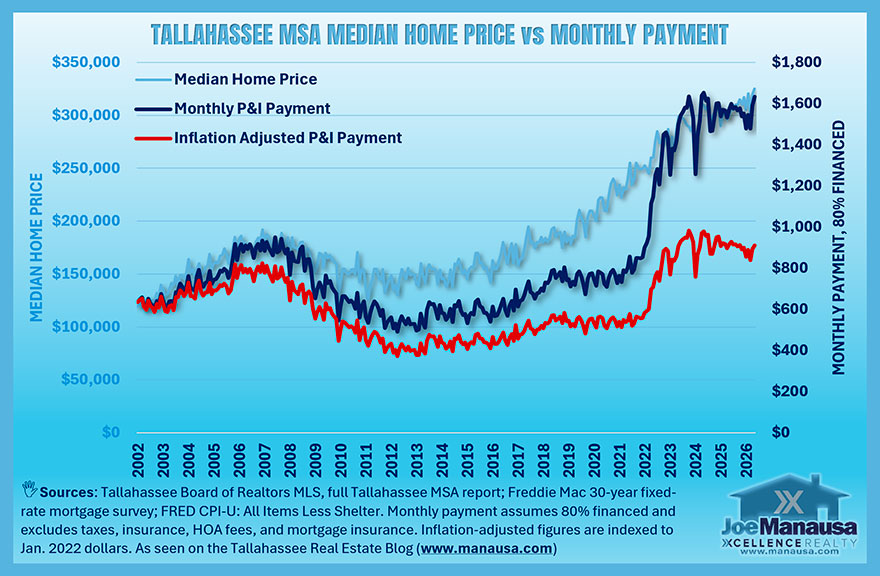
Let more than 30 years of experience work for you with charts, graphs, and analysis of the Tallahassee housing market.
Get Our Free Market Update

Other buyers, sellers, lenders, and real estate agents have this critical information, and now you can too!
Get immediate access to our most recent newsletter.
Let more than 30 years of experience work for you with charts, graphs, and analysis of the Tallahassee housing market.
Each Monday morning we send out a simple, one-page report that provides a snapshot of the Tallahassee housing market. It only takes 2 minutes to read, but it gives you better market intelligence than most real estate agents possess. Just tell us where to send it below!

Speak To A Local Expert!
 Joe was born and raised in Tallahassee and has been selling real estate for over 30 years.
Let us show you how to use our local knowledge of Tallahassee and the current state of the housing market to your advantage, ensuring you the best deal possible when selling or buying a home.
His past customers speak volumes (you will see Joe's past-customer reviews after you submit the form) on why you should hire Joe to be your real estate agent.
Talk to us today about helping you negotiate a better deal, with better terms, when selling or buying your home. You'll be glad you did!


How To Sell Your House On Your Own

10 PROVEN Strategies To Increase A Home's Selling Profit
2025s HOTTEST Home Selling Strategies You Need NOW
The 3-DAY Method To Sell Your Home For More (2025)

The Best Time To Lower The Price In A Home Sale

How FOMO Makes Your Home Sale More Profitable

Home Sale Sabotage: Top 10 Mistakes Sellers Make

How To EASILY Sell Your House For More Money

The Truth About Seller Fatigue: It Costs You 6 Ways

Watch: This Expert Shares Ironclad Home Selling Plan For FSBOs

8 Red Flags Warn Against Unscrupulous Real Estate Agents

How To Sell Your House When You Are In A Hurry

6 Real Estate Contract Terms You Should Not Overlook

12 Home Selling Tips For Retirees - Sell Home In Retirement

What Sellers Need To Know About Robo-Offers In Real Estate

I Asked An AI Why Real Estate Agents Ask Sellers For Price Reductions
Should you sell your home or rent it out?
Sellers: Get The Most $ For Your Home
How To Sell Your House Without A Real Estate Agent

Buy Now Or Wait? The 91.6% Rule
Biased Results? The New York Times Rent Or Buy Calculator
Do's And Don'ts During The Home Loan Process
6 Real Estate Contract Terms You Should Not Overlook

7 Tips On Buying A Home With A Pool
How much house can you actually afford (By Income)?

What Does "Marry The House Date The Rate" Mean In Real Estate?

Why Fixer Uppers Are the New Gold | Home Renovation Guide

8 Tips For Buying An Affordable Florida Vacation Home

New Home Construction: Buy Now or Wait for Prices To Drop?

6 Real Estate Investing Lessons from the 2008 Housing Bubble

Leveraging Seller Financing to Expand Market Opportunities

How To Avoid Common Legal Issues When Buying Or Selling A Home

Top 10 Neighborhoods to Live in Tallahassee for Families

How HGTV Is Like Meth For Homebuyers

How To Use Price Per Square Foot When Valuing A Home

Is Home Ownership A Hedge Against Inflation?

Need To Move? Buying vs. Renting Today

Buy A Home Now Or Wait For 2024?

How To Get A Good Deal On A Home

9 Tips For Buying A Home In A Bidding War

Don't Lose Your Real Estate Contract Binder Deposit

Four Smart Ways To Use A Real Estate Contract Assignment

Why It's Alway About Supply And Demand In Real Estate

Top 10 Tallahassee Neighborhoods

Should You Get A 40-Year Mortgage?
What Does A Transaction Coordinator Do?

The Best Time To Lower The Price In A Home Sale
Want to Sell Your Home Quickly and Profitably? Watch This Now
Time-Lapse Tree Removal!

What Does A Realtor Earn?
How To Sell Your House When You Are In A Hurry
Do's And Don'ts During The Home Loan Process
7 Tips On Buying A Home With A Pool
How much house can you actually afford (By Income)?
What Sellers Need To Know About Robo-Offers In Real Estate

Living In Tallahassee: 10 Things You Cannot Do In Tallahassee
What Does "Marry The House Date The Rate" Mean In Real Estate?

Home Affordability: Can New White House Plan Fix Housing?

Should Corporate Homeownership Be Made Illegal | Homeownership Matters
Why Fixer Uppers Are the New Gold | Home Renovation Guide
New Home Construction: Buy Now or Wait for Prices To Drop?
Sellers: Get The Most $ For Your Home
How To Sell Your House Without A Real Estate Agent
9 Mistakes to Avoid When Selling Your Home
Leveraging Seller Financing to Expand Market Opportunities

The Truth About A Dubious Real Estate Statistic

Pre-Marketing: Win the Home Selling Race

Top 7 Ways To Market Your Home For Sale Using Technology

Are you a NIMBY or a YIMBY?
How HGTV Is Like Meth For Homebuyers

Market Equilibrium, How The Balance Has Changed In Real Estate
How To Use Price Per Square Foot When Valuing A Home
Is Home Ownership A Hedge Against Inflation?

Are Wages Keeping Up With Rising Home Prices
Need To Move? Buying vs. Renting Today

Housing - Do You Follow Your Gut (Or Analytics) In Housing?

Mortgage Rates Are Expected to PLUMMET Below 6 Percent

Mortgage PITI Explained: Why Mortgage Payments Are Soaring!
Do's And Don'ts During The Home Loan Process

What 'normal' has meant over the years - Understand where rates are going

Will NINJA Loans Bring Down The Housing Market?
Should You Get A 40-Year Mortgage?

10 Mistakes Homebuyers Make In The Home Mortgage Process
Get Our Free Market Update
Other buyers, sellers, lenders, and real estate agents have this critical information, and now you can too!
Get immediate access to our most recent newsletter.
Let more than 30 years of experience work for you with charts, graphs, and analysis of the Tallahassee housing market.
Each Monday morning we send out a simple, one-page report that provides a snapshot of the Tallahassee housing market. It only takes 2 minutes to read, but it gives you better market intelligence than most real estate agents possess. Just tell us where to send it below!
How To Get 20% Or More With Leveraged Real Estate
8 Tips For Buying An Affordable Florida Vacation Home
Should you sell your home or rent it out?

Is turning your college student into a homeowner a wise investment or a financial faux pas?
6 Real Estate Investing Lessons from the 2008 Housing Bubble
How To Avoid Common Legal Issues When Buying Or Selling A Home

Should You Buy A House For Your Child?
How To Use Price Per Square Foot When Valuing A Home
Is Home Ownership A Hedge Against Inflation?
Four Smart Ways To Use A Real Estate Contract Assignment
Why It's Alway About Supply And Demand In Real Estate
How Often Do Home Prices Fall?

How Much Should You Put Down On A House?

Real Estate Negotiation Strategies For Each Market Condition