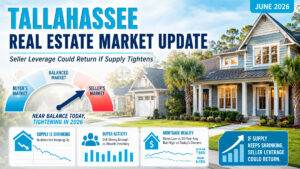
If you are concerned with home prices and the health of the real estate market, then you should keep an eye on the supply and demand for homes in the market in which you live.
That’s what I’ve done today for Tallahassee, and from what I’m reading and hearing from agents around the country, our report could easily apply to those market areas too. If you asked the top agents around the country what they’d like to see in the near future, we’d all tell you the same thing. We need more homes!
Today’s report dissects the supply-side of the housing market, examining what’s coming in, what’s under contract, and what present levels mean for home values and buying a home today.
I’ve included a list of the current active listings in Tallahassee, sorted by price from high to low. As you scroll down towards lower-priced homes, take note of just how many of them are already under contract with buyers!
New Listings In Tallahassee
Tallahassee Homes for Sale


Why It’s So Difficult To Find A Home
This graph shows the growing difficulty for homebuyers seeking available properties in the market.

Here we examine all the homes currently listed for sale in Tallahassee, grouped into two different stages. Homes for sale that are already under contract with buyers are shown in blue, while those for sale not yet under contract with buyers are shown in red.
From left to right, look at how the inventory has reversed. On the left side of the graph, the height of the red bars was about four times the height of the blues, meaning there were far more homes for sale NOT under contract than there were homes under contract with buyers.
Right now, an amazing 67% of all current listings on the market are already under contract with buyers. The graph only shows 63%, but I produced the graph 3 weeks ago. Today, more than two out of every three active listings have contracts today versus just 40% just one year ago.
In order to clarify the impact of this information, one must understand that when buyers today go online and look at homes for sale, most of the homes they see are not really available, as other buyers have them secured with contracts. Just the other day, a buyer sent us a list of five homes they wanted to see, and they were all just proposed construction (meaning they were vacant lots where the builders have not yet even started the homes. As I have been saying for years, the supply of homes for sale is far too low for buyers to be able to casually shop for a home. And the situation continues to get worse, not better.
The dashed green line plots the 12-month average of the “under-contract” trend which has now exceeded 50%. We had never seen this trend hit 40% until last year, and now it is exploding through the roof. This means that over the past twelve months, more than one-half of all listed properties were under contract at any given time.
Let’s take an in-depth look at the supply side of the housing market and examine exactly what’s happening that is causing the decline in the inventory of homes for sale.
Year Over Year Fresh Listings
For three consecutive months, the number of fresh listings entering the market has fallen. Considering 2021 had begun the year with too few listings, this is not a good way to restore health to an undersupplied housing market.

The graph above shows a comparison of how each month fared (percentage-wise) compared to the same month in the prior year for fresh new listings entering the MLS.
I use the term “fresh” to describe homes listed for sale that were not previously listed. These are homes that are truly new to the market, not merely old inventory that was canceled and relisted by the agent or a new agent.
2021 has started off with nearly 19% fewer fresh existing listings than what entered the market in the first quarter of last year, so this is not a good sign for buyers seeking more choices when shopping for a home. On the other hand, it only makes it easier for a seller wanting to get top dollar when selling a home.
From a seasonality standpoint, I am expecting a “normal” year in 2021, where most listings enter the market now through the Summer. Last year produced very different results than what we normally see. With COVID impacting 2nd-quarter listings, we perhaps will see a reversal in the year-over-year trend when we next produce an inventory report.
Recent Housing Market Reports

Tallahassee Housing Economic Update
Tallahassee Florida Spring Economic Update
Tallahassee/US Housing Market Update Feb 2024

Which Home Sizes Are Skyrocketing In 2024?

Top 10 Neighborhoods to Live in Tallahassee for Families

Wealth Gap Widens Luxury Home Market Booms Unprecedentedly
Fresh Existing Inventory Report
While the last graph showed a month-to-month comparison of fresh new listings, this one shows fresh listings of existing homes in the first quarter of each year.
We see that the number of fresh (existing home) listings fell nearly 19% in the first quarter when compared to the same three months last year. So how low is the count of this year’s new listings? The lowest! This makes 2021 the worst year in the past 8 when ranking years by the number of fresh new listings entering the market.

The housing market started the year with too few homes for sale, so the reduction in fresh existing home listings, coupled with heightened demand, has pushed prices higher and created pent-up demand for homes.
You might believe this is “good news” for sellers as their homes are now worth more, you also have to remember that most sellers are going to be buying another home in the same market (with the same soaring prices and the same lack of inventory).
Of course, the existing home sales market does not stand alone. We also need to examine what the builders have been doing.
Fresh New Construction Homes
Similar to the previous graph that showed fresh listings for the existing homes market, this graph shows freshly listed new construction homes.

Homebuilders did well last year to raise construction activity, but they fell woefully short of what the market needed. Now it appears as if they are falling backward, not pressing forward delivering the inventory that we need. We need local builders to be producing more homes.
With builders producing homes at a slower rate, rapid appreciation has taken over the housing market. Last year’s appreciation of 9.3% was nearly triple what we would expect in an average year, and this year is going to double that (or worse). As I have warned in previous reports, home values could very well surpass 20% growth this year.
Back in the 1990s, builders were bringing more than 1,100 new homes per year to the market. In the next decade, the average was over 1,300 homes. The last decade saw that average decline to 434 homes per year.
The decline in new construction was needed in 2007, as the market was grossly over-supplied and required time to consume all the extra homes. That correction was completed in 2016, and Tallahassee has needed about 1,200 homes per year since, instead of just 434.
The difference between the two represents an additional 2,000 to 3,000 homes that could have been built and sold, and this would have kept our recovery going strongly with homes appreciating nicely, but not out of control like we are seeing today.
Right now, with a large shortage of homes, builders should be permitting about 2,000 homes and monitoring the supply and demand numbers to ensure that they’re not building too many at any given price point.
That means the 107 new listings in the first quarter could really have been 1,000 or more, so new construction activity is nowhere what is needed!
Slow production means that builders missed an opportunity to sell an additional several thousand homes over the past five years. The void that these missing homes did not fill will only disfigure our housing market further in 2021.
Now let’s ponder the global view of the supply side of our market, where we combine new homes with used homes which produces the following graph detailing the total number of fresh new listings that have entered the market through February.
All New Listings In Tallahassee
This graph reveals that the combination of builder homes and existing homes makes 2021 the leanest year (of the past 8 years) for new inventory. Remember, today’s sky-high demand has created optimal market conditions for sellers, so there is no reason for incoming listings to be so low.

Of course, with the influx of new homes dropping, the relative supply of homes for sale has fallen even lower. So what does that mean?
It means tough sledding for buyers. As the hottest months of buyer activity approach, we find the inventory far too low to satisfy summer seasonal demand. So let’s make this simple. Supply is low, demand is high, so home prices are going through the roof.
No More Shadow Inventory
The shadow inventory of homes that we identified so long ago has been reduced to nothing.

The graph above shows the stale listings coming back into the market each year in the first two months. “Stale” listings are those that were recently listed with another broker and failed to sell. Now the sellers are returning to the market with new brokers.
The 103 stale listings entered in 2021 are 71% fewer than the 356 stale listings that entered the market in the first quarter of 2015, and 29% fewer than what we reported last year. The shadow inventory never really goes away, but it’s as small as we’ve seen it since the market crash of 2006.
Months Of Supply Of Homes
This table measures the supply of homes for sale, relative to the current rate of demand. The resulting number for each area and the price range is measured in “months of supply,” and what makes the market balanced is a measure of 6.0.
Historically, a market with six months of supply has produced steady home sales and an appreciation rate just over 3%. When the relative supply drops below 6 months of supply, we call this a seller’s market as there are more buyers than sellers. When the numbers rise above 6, we refer to that as a buyer’s market, as there are more sellers than buyers. Red shaded areas reveal a seller’s market condition. Orange areas remain in a buyers’ market, while the few white shaded areas are fairly balanced.

The table clearly shows that the supply of homes for sale, relative to the current hot rate of demand, remains near a record low. With the decline of fresh new listings combined with the growth of the buyer pool, the months of supply of homes for sale is terribly low. This table shows you why 67% of our current listings are already under contract with buyers.
For every buyer that closed on a home in March, there was more than one buyer that missed out on the chance to buy a home. The closings could have been more than double the rate closed had there been more available listings.
We need builders to step up and produce inventory in the areas and price ranges shaded in red if they are capable. Obviously, we’re not going to see a builder bring in new units under $100K in NE Tallahassee, but there are a lot of red-shaded areas in our table that should be pursued.
If I were a builder and wanted to ensure that I did not build homes that the market does not need, I would look at the red-shaded areas with a value below 5 months of supply. The market is demanding these homes, why not build and sell them?
If you are a local home builder who would like analytical guidance on where and what to build, I’m happy to help, just give me a call.
For non-builders, you should know that this is the hottest seller’s market ever, so if you’ve been thinking about moving, it’s time to act.
Right now, mortgage interest rates are low and you have sky-high demand for your home. Mortgage interest rates have fallen again, but they have moved up from a bottom that formed many months ago. Rising rates will eventually reduce demand, resulting in fewer buyers for your home.
Rising mortgage interest rates will not likely reduce the value of your home, but the rising cost of borrowing money will increase your monthly payment on the home you buy next.
If you plan on buying a home after you sell your current one, take advantage of low mortgage interest rates, or just take advantage of the strong demand that these low rates have created.
Don’t be the one among your group of friends who in the future says, “you know, I should have taken advantage of those mortgage interest rates back in 2021 when they were so low!”
When moving to, in, or from Tallahassee, you will fare better if you work with a local expert. We are here to help. If you have further questions on the Tallahassee real estate market, you can leave a comment below, give us a call at (850) 366-8917, or drop us a note and we'll give you the local information needed to ensure a successful, smooth transaction.
As a local born and raised in Tallahassee with a focus on customer service, I promise you'll find great success when working with Joe Manausa Real Estate, just as have our past customers. You can read thousands of their reviews reported on Google, Facebook and Zillow right here: Real Estate Agent Reviews Tallahassee.
 Have you heard about my new book "The Business of Getting Business?" It's a comprehensive guide for small businesses to help them make the move to digital. For those of us who want to survive and thrive in a world where large corporations are taking over, it is a must-read. It's also the perfect guide for how to sell a home in the digital age. You can find The Business Of Getting Business by clicking on any of the trusted retailers below.

Think all REALTORS are alike?
Read what people are saying about working with Joe Manausa Real Estate! You can see thousands of real customer reviews reported on Google, Facebook and Zillow at this link: CLICK HERE FOR REAL ESTATE AGENT REVIEWS.