Fresh Listings and Inventory Infusion
Let’s start with some good news: there has been an increase in new home listings.

In May, new listings rose by eight percent compared to the previous month and eleven percent compared to last year. This is significant because it indicates that more homeowners are ready to sell. This shift can be attributed to a phenomenon known as the “rate lock” effect easing. Homeowners were previously hesitant to sell because they didn’t want to lose their low mortgage rates. But a Zillow survey found that about eighty percent of recent sellers were motivated by life events rather than just financial conditions.
This kind of motivation is driving sellers to list their homes, adding much-needed inventory to the market. However, while more homes are available, buyers aren’t matching this increased activity. In May, sales were six percent lower than last year’s already low volume. This partial restock of the housing market has raised the number of homes by twenty-two percent compared to last year’s near-record-low level. Despite this, inventory is still thirty-four percent below pre-pandemic levels, the smallest deficit in over three years. (but far short of the inventory levels that have been historically deemed normal). The market is still grossly undersupplied, but Zillow tells us there are solid signs of improvement.
Get Our Free Market Update

Other buyers, sellers, lenders, and real estate agents have this critical information, and now you can too!
Get immediate access to our most recent newsletter.
Let more than 30 years of experience work for you with charts, graphs, and analysis of the Tallahassee housing market.
Each Monday morning we send out a simple, one-page report that provides a snapshot of the Tallahassee housing market. It only takes 2 minutes to read, but it gives you better market intelligence than most real estate agents possess. Just tell us where to send it below!
Easing Competition and Slowing Appreciation
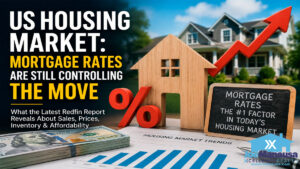
With more homes available and fewer buyers competing, the market dynamics are shifting. Buyer competition eased in May, cooling home price appreciation. When we look to the Zillow Home Value Index, it shows that annual home value growth slowed from four-point-four percent in April to three-point-nine percent in May.

Home values are now forty-five percent above pre-pandemic levels. That means for the past 4 years, we’ve seen the average annual appreciation rate approach 9%! That’s nearly double the historical growth rate and a big part of the home affordability crisis.
Renters saving for a down payment might get some relief as well. Zillow forecasts that home values will rise by zero-point-four percent by the end of twenty-twenty-four and decrease by one-point-four percent through May 2025. Zillow believes that potential buyers might find slightly more affordable options shortly, though I am not so sure.
What It Means for Buyers and Sellers
Zillow’s Market Heat Index provides a snapshot of local housing market activity across the US based on the number of views and saves for homes listed on their platform. It indicates the relative level of buyer demand and seller interest in specific areas.

The heat map indicates a shift toward a more buyer-friendly market, although sellers still have a slight advantage. For example, sellers are in a strong position in cities like Buffalo, Hartford, and San Jose. In these areas, homes are selling quickly and often above list price. On the other hand, markets like New Orleans, Miami, Jacksonville, and Memphis are more favorable for buyers, offering better negotiation leverage.
Zillow announced that nationwide, nearly a quarter of homes for sale made a price cut in May, the highest share in at least six years for this time of year. Buyers may find deals on properties that have been on the market for a while. This environment makes experienced real estate agents valuable for both buyers and sellers, as they can help navigate the changing dynamics to find deals and market properties effectively.
Now, let’s learn what Zillow has assembled for home values.


Fannie Mae Report: It's The TRUTH About The Housing Market

Real Estate Meltdown: Starter Homes at $1M in 233 Cities

Is the Housing Market Crashing? | Redfin April 2025 Update

Is This The CALM Before The CRASH? Volatility Rocks Housing

Warning Signs For Home Buyers And Sellers
Home Values – Still Moving Higher
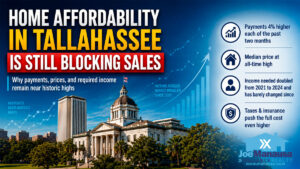
Zillow reports that the typical U.S. home value is now three hundred sixty one thousand dollars, with a monthly mortgage payment of one thousand nine hundred thirty-one dollars, assuming a twenty percent down payment.

Home values rose in all fifty largest metro areas in May. The biggest gains were in Buffalo (two-point-one percent), Pittsburgh (one-point-nine percent), Cleveland (one-point-eight percent), San Jose (one-point-eight percent), and Hartford (one-point-seven percent). The smallest gains were in Austin (zero-point-two percent), Tampa (zero-point-three percent), San Antonio (zero-point-three percent), Orlando (zero-point-three percent), and New Orleans (zero-point-four percent).
Year-over-year, home values increased in forty-seven of the fifty largest metro areas in the US. With so many YouTube channels declaring a market crash, you have to wonder where they are getting their data. Home values increased in 94% of the fifty largest metro areas in the US!
The highest annual gains were in San Jose (twelve-point-seven percent), Hartford (eleven-point-six percent), San Diego (eleven-point-one percent), Los Angeles (eight-point-nine percent), and Boston (eight-point-three percent). Home values fell in three major metros: New Orleans (negative five-point-nine percent), Austin (negative four-point-one percent), and San Antonio (negative two-point-two percent). The typical mortgage payment is up eleven-point-three percent from last year and has risen by one hundred fifteen-point-three percent since pre-pandemic. Now, make sure you heard that correctly: the typical mortgage payment is more than double the pre-pandemic payment, and most of what Zillow reports suggest it will get worse due to the limited supply of homes in the US.


Housing Crash or Boom? Here’s What’s Coming in 2025

BIGGEST Housing Market Myth EXPOSED by New Foreclosure Data
Inventory and New Listings
New listings rose by 8 percent month over month in May and by 18 percent compared to last year, but remain 23 percent lower than pre-pandemic levels.

Active listings increased by seven-point-four percent from last month and by twenty-two-point-one percent compared to last year. Inventory levels are still thirty-three-point-eight percent below pre-pandemic levels, the smallest deficit in over three years.
Consider a scenario here in Tallahassee, where my office sees the increase in new listings as a market-shift opportunity. With more homes on the market, we advise our clients to price their homes competitively and use our aggressive pre-marketing strategies to attract multiple buyers quickly. This strategy pays off as our clients’ homes sell faster and at better prices than they anticipated.
Our expertise in understanding the changing market dynamics and our proactive approach help our clients navigate the competitive environment successfully. By using data to guide our pricing strategy and focusing on presenting homes in the best possible light, we ensure that our clients’ properties stand out in a less lean market. This approach results in quicker sales and maximizes the money sellers receive, benefiting both the sellers and the buyers who found well-maintained homes ready for move-in.
Price Cuts and Share Sold Above List
In May, twenty-four percent of listings had a price cut, up from twenty-two percent in April and nineteen percent last May. In April, one of every three homes sold above their list price, up from thirty percent in March but down from thirty-five percent in April 2023.

The key takeaway here is that while more sellers are cutting their asking prices, the reality is that the low inventory levels are creating bidding wars that result in a third of home sellers receiving more than their asking prices.


How To Sell Your House On Your Own

10 PROVEN Strategies To Increase A Home's Selling Profit
2025s HOTTEST Home Selling Strategies You Need NOW

The 3-DAY Method To Sell Your Home For More (2025)

The Best Time To Lower The Price In A Home Sale

How FOMO Makes Your Home Sale More Profitable

Home Sale Sabotage: Top 10 Mistakes Sellers Make
Newly Pending Sales
Next, Zillow reports the trend of pending sales. A pending sale is one where the seller has signed an agreement with a buyer and is now working through the due diligence process so they can head to closing. Zillow tracks pending home sales to gain insight into what next month’s closings will look like. Newly pending sales remained steady from the prior month but decreased by four-point-two percent from last year.

The median days to pending remained at thirteen days in May, unchanged from April but three days longer than last year. To add a historical perspective, it was very common when I got into the business in the early 1990s to see the average market time for most homes be around 60 days.
After the Great Recession, when the market hit bottom in 2012, it was typical for median days to pending to surpass 100 days in my market, with only 30% of homes selling. Zillow’s report of a 13-day market time is excellent news for home sellers and indicates that homebuyers should brace for a highly competitive market.
Rents Are Rising Too (No Relief For People Moving)
Our final graph is one that I don’t see enough real estate reports study. Even though most of us focus on the for-sale market, we must monitor the for-rent market to understand the overall supply and demand for housing. Fortunately, Zillow makes this easy with the rent reports.

Landlord asking rental rates increased by zero-point-six percent month over month in May, slightly below the pre-pandemic average of zero-point-seven percent for this time of year. Rents are up three-point-four percent from last year but have an average annual growth of 6.7% since pre-pandemic levels.
Monthly rents fell only in Birmingham (negative zero-point-three percent), held steady in Tampa and New Orleans, and rose slightly in Louisville (zero-point-one percent) and Miami (zero-point-one percent). Year-over-year, rents increased in forty-eight of the fifty largest metro areas, with the highest increases in Providence (seven percent), Hartford (seven percent), Louisville (six percent), Cleveland (six percent), and Buffalo (six percent).
The study of rental rates is imperative because most people waiting to buy a home are facing rent increases while home prices are rising. There is no cost-savings in an undersupplied housing market. Renters face inflation; buyers can generally lock in their monthly costs with a fixed-rate mortgage.
The Best Time To Lower The Price In A Home Sale
Want to Sell Your Home Quickly and Profitably? Watch This Now
Time-Lapse Tree Removal!

What Does A Realtor Earn?

How To Sell Your House When You Are In A Hurry

Do's And Don'ts During The Home Loan Process

7 Tips On Buying A Home With A Pool

How much house can you actually afford (By Income)?