Summary
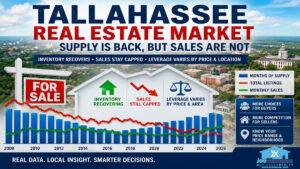
The Greater Tallahassee housing market midyear update shows an active market that is slower than the peak years, more payment-sensitive than many sellers realize, and far more segmented by ZIP code and price range than a metro-wide headline can explain. Because it has now been more than a month since June ended, roughly 99% of all closed home sales should now be reported through our combined Tallahassee MLS and Metro Market Trends source set. That matters because this data captures more than MLS-only reporting, and historically, about 20% of all home sales are not found in the MLS. Sales remain below the strongest pandemic-era years; the latest year-over-year sales reading is negative; monthly payments remain elevated; and months of supply vary sharply across the Tallahassee MSA housing market.
Key Takeaways
- The midyear sales picture is reliable now. Since more than a month has passed since June ended, roughly 99% of closed home sales should be reported through our combined Tallahassee MLS and Metro Market Trends sources.
- The data is broader than MLS-only reporting. Historically, about 20% of all home sales are not found in the MLS, so this report has a wider view than a Realtor using MLS data alone.
- Sales are slower than the peak years. Year-to-date sales through June remain below the 2021 and 2022 highs.
- The latest sales momentum is negative. The most recent year-over-year sales reading shows a decline, which means the market is still dealing with buyer resistance.
- Payments remain the core issue. Principal-and-interest payments remain far above the pre-2022 pattern, and that understates the full cost of ownership.
- Supply is local and segmented. The Tallahassee area housing market is not equally tight or loose across all ZIP codes and price ranges.
Greater Tallahassee Housing Market Activity Through June
The Greater Tallahassee housing market is now far enough past mid-year to give us a reliable read on the first half of 2026. Since it has been more than a month since June ended, roughly 99% of all home sales should now be captured through our combined Tallahassee MLS and Metro Market Trends sources. That matters because early market reads can be noisy, but this update is late enough to treat the midyear numbers as a solid measure of sales activity, pricing, payment pressure, and supply.
This is not the same as looking at MLS data alone. The source set used for these graphs includes Tallahassee MLS data and Metro Market Trends, which provides a broader view of local housing activity than a Realtor can see by searching the MLS. Historically, about 20% of all home sales are not found in the MLS, so a full market report needs more than MLS-only reporting to explain what is really happening.
The important point is not that the market is strong or weak in one simple way. It is that the market has become more selective. Buyers are still active, but higher payments limit what they can buy. Sellers can still succeed, but pricing, condition, presentation, and local supply matter far more than they did during the fastest market years.
For context, this report builds on recent local analyses of Tallahassee homes taking longer to sell, Tallahassee home affordability, seller leverage in the Tallahassee real estate market, and Tallahassee MSA home prices by ZIP code. The current midyear report pulls those themes together with sales pace, payment pressure, ZIP code pricing, and segmented supply.
Midyear Sales Show A Slower, More Selective Market
The first question is simple: how much buying is actually happening? Year-to-date sales through June give us a cleaner read than one monthly number because they smooth out some short-term noise.
Year-to-date sales through June show that the market is still functioning, but not at the intensity seen in recent years. The 2026 bar remains below the 2021 and 2022 peaks, which is consistent with a market shaped by higher borrowing costs, payment resistance, and more selective buyers.
However, this graph does not prove demand has disappeared. It shows closed sales, not every household that wanted to buy but could not make the monthly payment work. It also benefits from a broader set of sources than MLS-only reporting, which matters because a meaningful share of local home sales has historically occurred outside the MLS.
Some buyers are still shopping, some have paused, and others have moved down in price because affordability changed. This is why sellers should not read the market as frozen, and buyers should not assume every seller is desperate. Instead, both sides should treat the Greater Tallahassee housing market as active, but more conditional than it was a few years ago.
Greater Tallahassee Housing Market Sales Momentum Is Uneven
Year-to-date sales show the accumulated result. The next graph shows the current pressure by comparing each month’s home sales with the same month one year earlier.
The latest year-over-year home sales reading is negative, with the graph showing a recent decline of roughly 9.6%. That matters because it tells us the market is not simply gliding back to the pace seen during the strongest recent years. The path remains uneven, and buyer activity is still sensitive to affordability.
Still, a year-over-year sales graph can make a single month feel more dramatic than it should. A weak monthly comparison does not automatically mean a crash. It means this month’s sales count was lower than it was last month. The useful question is why.
The answer points back to the same issue shaping housing across the country and across the Tallahassee area housing market: payment pressure. The US housing market has been shaped by mortgage rates for several years, and local buyers are still making decisions inside that payment reality.
Payment Pressure Still Defines The Tallahassee Area Housing Market
When people talk about housing affordability, they often focus on home prices. Prices matter, but the monthly payment is what determines whether many buyers can act. The next graph shows the year-over-year change in the estimated monthly principal and interest payment.
The year-over-year payment change exploded after 2022, then cooled as the market adjusted. That does not mean homes became affordable again. It means the rate of payment growth slowed after the initial shock.
This is one of the most misunderstood parts of the current Greater Tallahassee housing market. A payment chart can show smaller year-over-year increases while buyers still feel squeezed. That happens because the market is now operating on a much higher payment basis than it did before mortgage rates reset.
This graph also understates the real affordability burden because it focuses on principal and interest. A buyer’s full monthly housing cost usually includes property taxes, homeowners insurance, mortgage insurance when applicable, HOA fees, maintenance, utilities, and sometimes flood insurance or other costs. The Consumer Financial Protection Bureau explains how buyers should think about total monthly housing costs, which matters even more in Florida, where property taxes and homeowners insurance have become a larger part of the ownership decision.
Prices And Payments No Longer Tell The Same Story
The next graph shows median home price, estimated principal-and-interest payment, and inflation-adjusted payment pressure in a single long-term view. This helps explain why many buyers feel as if the market changed more than prices alone suggest.
This graph shows why many buyers feel worse than the price chart alone would suggest. Median prices rose over the long term, but the monthly principal-and-interest payment increased much faster once mortgage rates changed. The payment line is the practical constraint that forces buyers to lower their price range, increase their down payment, accept a smaller home, or wait.
The inflation-adjusted payment line adds another useful layer. Even after accounting for inflation, the payment burden remains meaningfully above the pre-2022 pattern. In plain English, buyers are not just reacting emotionally to sticker shock. The monthly cost of buying a home they can reasonably afford has changed.
This is also why sellers need to understand the buyer sitting across the table. A seller may compare today’s offer with yesterday’s home price. A buyer compares today’s price with today’s payment. Those perspectives are different, and successful negotiations often come down to understanding that gap.
For readers who want the source framework, the payment analysis uses the Freddie Mac Primary Mortgage Market Survey for 30-year fixed-rate mortgage data and the FRED CPI less shelter index for inflation adjustment. The home-price foundation comes from Tallahassee MLS and Metro Market Trends, which creates a broader local sales view than MLS-only reporting. For local context, review the recent Tallahassee real estate affordability review.
ZIP Code Prices Show Why Metro Averages Can Mislead
The Greater Tallahassee housing market is not one uniform price point. Buyers searching in 32312 are not facing the same price environment as buyers searching in 32310, 32304, or 32305. The next graph shows current median prices by ZIP code.
The ZIP code price spread is large. The graph shows 32310 at $147,925, 32304 at $180,000, 32305 at $220,000, 32308 at $375,000, 32309 at $395,000, 32317 at $441,500, and 32312 at $554,447.
This matters because a metro-wide median can hide the market a buyer or seller actually faces. A move-up buyer, first-time buyer, luxury seller, downsizing homeowner, or investor may each be operating in a different market even though all are inside the Tallahassee MSA.
It also explains why broad statements about the market often fall short. The luxury homes in Tallahassee price split is different from the entry-level affordability problem. The Tallahassee housing market’s demand by area differs from a metro-wide sales count. Local decisions need local data.
Tallahassee MSA Housing Market Supply Varies By Segment
Prices show what buyers are paying. Months of supply helps explain the balance between available homes and the current sales pace. This is one of the most useful graphs in the report because it shows both ZIP code and price range.
The metro-wide total is about 5.0 months of supply, only slightly above last month’s 4.9 reading. At first glance, that looks close to balance. But the detailed grid shows why the average is not enough.
Some ZIP codes remain relatively tight. Others have far more supply. For example, the chart shows lower overall supply readings in ZIP codes such as 32308 and 32309, while 32346 and 32351 show much higher overall readings. Price ranges also vary, with some brackets showing very limited supply and others showing enough inventory to give buyers more room.
This is where buyers and sellers should slow down. A buyer should not assume that 5.0 months of supply means every seller is negotiable. A seller should not assume that strong prices mean every listing will move quickly. The right question is: what is the supply level in your ZIP code, price range, property type, and condition category?
For additional perspective, the Leon County real estate market supply report and Tallahassee metropolitan statistical area housing market update show why supply metrics are more useful when they are local and segmented. Nationally, the National Association of Realtors explains its existing-home sales and months-of-supply methodology, which reinforces the idea that inventory should be interpreted alongside the sales pace.
Why A Broader Source Set Matters
A market report is only as useful as the data behind it. MLS data is valuable, but it is not the entire housing market. Historically, about 20% of home sales are not on the MLS, which means an MLS-only view can miss a meaningful share of the market.
That is why this report uses both Tallahassee MLS and Metro Market Trends data. The broader source set helps capture sales that would not appear in a Realtor’s MLS search alone, making the midyear view more complete. It also helps readers understand why the graphs are designed to explain the Greater Tallahassee housing market, not just MLS-listed activity.
This matters most when comparing sales volume, prices, and long-term trends. If one source misses a meaningful share of transactions, the story can become too narrow. The goal here is to make the reader better informed by using the broadest practical local housing data available.
What Buyers Should Do Now
Buyers in the Greater Tallahassee housing market should treat today’s market as an opportunity to be more selective, not as permission to be careless. More supply in some segments can create room for negotiation, but well-priced homes in desirable locations can still attract attention quickly.
The payment reality should come first. Before you focus on list price, calculate the full monthly cost, including taxes, homeowners insurance, mortgage insurance, HOA fees, utilities, maintenance, and likely repair needs. Also compare areas carefully. A ZIP code with a lower median price may open the door to ownership, but condition, commute, school zone, and resale profile still matter.
Buyers should also watch the difference between a stale listing and a correctly priced listing. Homes that have missed the market may offer room for negotiation. Homes that are priced right from the start may not.
What Sellers Should Do Now
Sellers should not panic, but they should respect the new market. The Tallahassee MSA housing market is no longer rewarding every listing equally. Pricing, condition, photography, pre-marketing, showing access, and early feedback matter more than they did during the fastest years.
The payment graphs should change how sellers think about their buyer pool. A buyer who qualified easily three or four years ago may now be forced into a lower price range. That means buyers are more sensitive to condition, concessions, closing costs, insurance, and repairs. A seller who ignores those costs may overestimate what buyers can actually pay.
If you are planning to sell, compare your home against active competition, not just closed sales. Closed sales tell you what buyers accepted in the past. Active listings show what buyers can choose today.
What Homeowners And Investors Should Watch
Homeowners should use this report as a timing and equity check. Even if you are not moving, the data still matters because it affects refinancing decisions, renovation plans, insurance planning, and future resale strategy. If you are moving, the right pricing plan depends on the supply level in your exact segment.
Investors should be even more conservative. Higher borrowing costs change cash flow. Insurance costs can change holding risk. Slower sales can change exit assumptions. The current Greater Tallahassee housing market still offers opportunities, but the numbers need to work under today’s costs, not under 2021 assumptions.
Frequently Asked Questions
Is the Greater Tallahassee housing market crashing?
No. The current data do not show a crash. Sales are slower, and the latest year-over-year sales reading is negative, but prices remain elevated, and supply conditions vary by ZIP code and price range.
Why does this report use more than MLS data?
This report uses Tallahassee MLS and Metro Market Trends data because MLS-only reporting does not capture every home sale. Historically, about 20% of all home sales are not found in the MLS, so the broader source set provides a more complete view of the Greater Tallahassee housing market.
Is the Tallahassee area housing market better for buyers now?
In some segments, yes. Buyers may have more choices and more negotiating room where months of supply is higher. However, payment pressure remains a major obstacle, and well-priced homes can still move quickly.
Why do monthly payments matter more than prices right now?
Monthly payments determine what many buyers can actually afford. Higher mortgage rates, insurance costs, property taxes, and other ownership expenses can force buyers into lower price ranges even when home prices are not falling.
Why should sellers look at ZIP code and price range data?
Metro-wide averages can hide the conditions that matter most. A seller in a tight ZIP code and price range faces a different market than a seller in a segment with a much higher months-of-supply.
We Are Here To Help
The Greater Tallahassee housing market is more local, more payment-sensitive, and more segmented than the headline numbers suggest. That makes good interpretation more valuable, not less.
If you are buying, selling, or deciding whether to hold, get a local read before you act. The Joe Manausa Team at Xcellence Realty can help you compare your ZIP code, price range, property type, and timing against the current data so you can make a better decision.

















 Don't be the one that doesn't know what's going on when you sell a home or buy a home in Tallahassee.





 Have you heard about my new book "The Business of Getting Business?" It's a comprehensive guide for small businesses to help them make the move to digital. For those of us who want to survive and thrive in a world where large corporations are taking over, it is a must-read. It's also the perfect guide for how to sell a home in the digital age. You can find The Business Of Getting Business by clicking on any of the trusted retailers below.