Should You Buy A House For Your Child?

One popular idea is to buy a home as an investment and sell it when it's time for college tuition

As you hold your newborn in your arms, your mind may already be buzzing with plans for their future, including how to finance their college education.

As the years go by, you want to ensure they have the best education possible, but how will you pay for it? One popular idea is to buy a home as an investment and sell it when it's time for college tuition.

But before you jump into the real estate market, let's look at the facts and figures to determine if this is a wise financial decision.

Today's report is a comprehensive examination of buying a median-priced home in Tallahassee, leasing it out until your child turns 19, and then selling the home to generate the cash needed for your child's education.

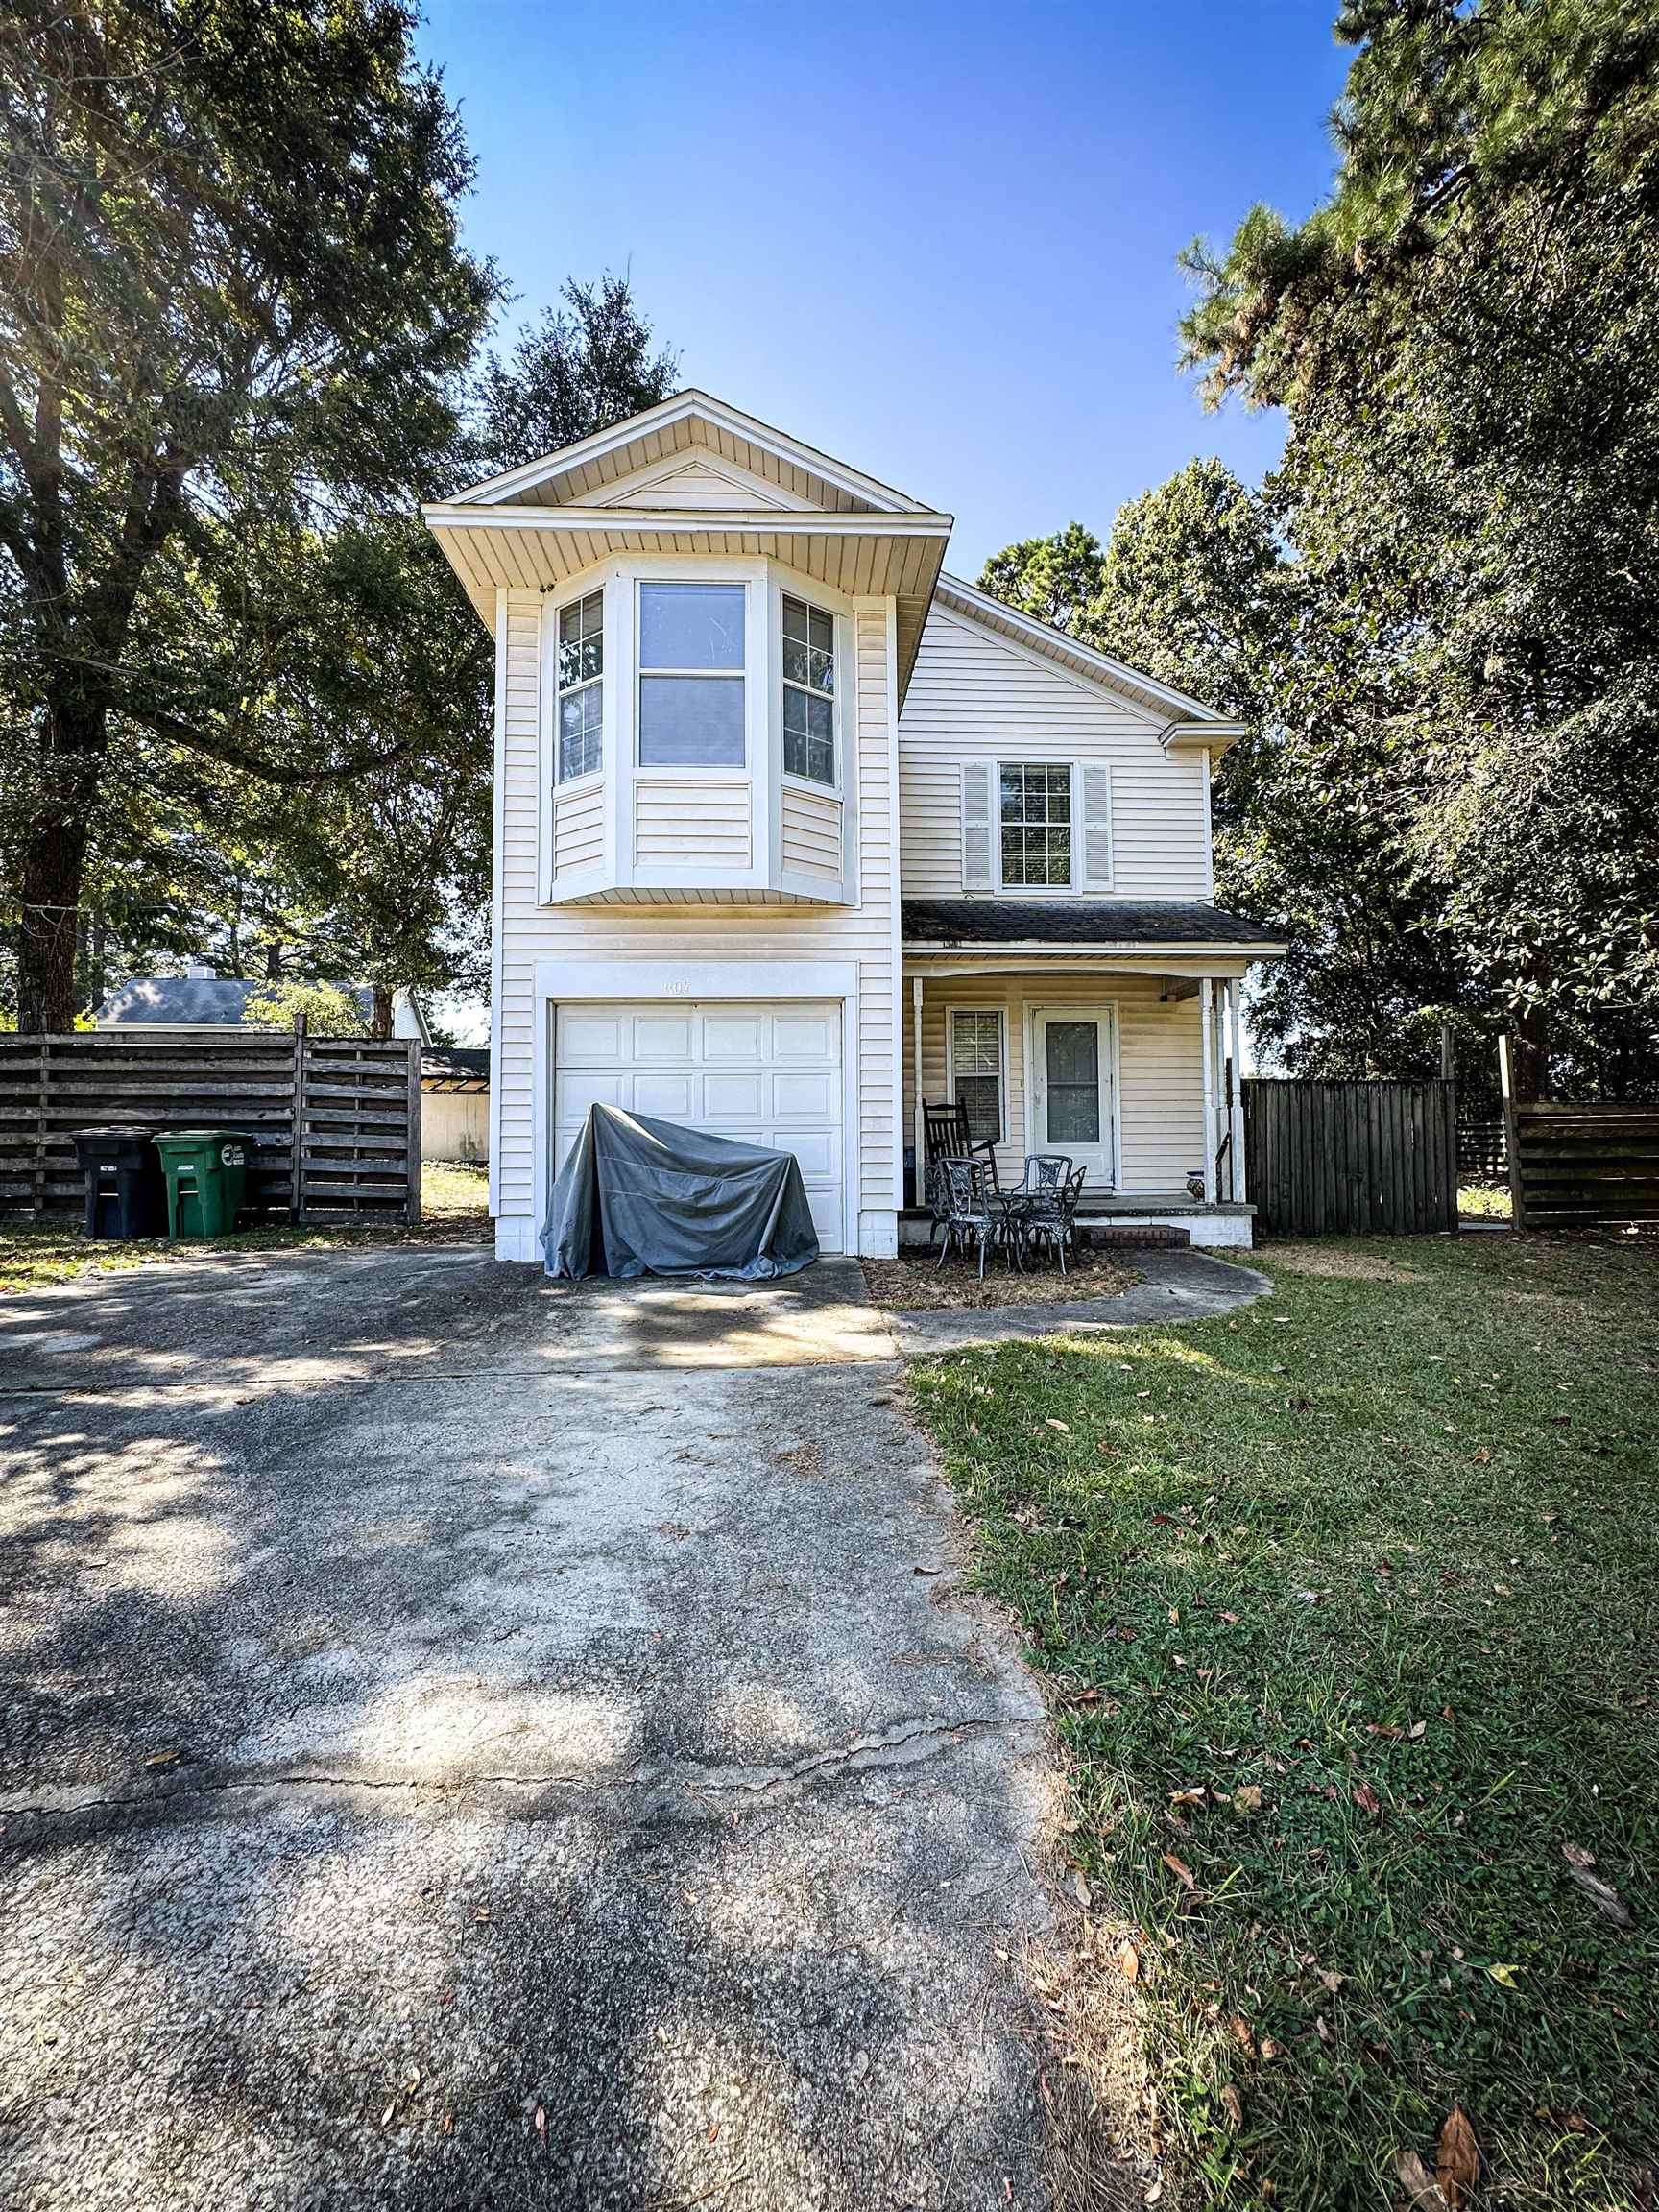
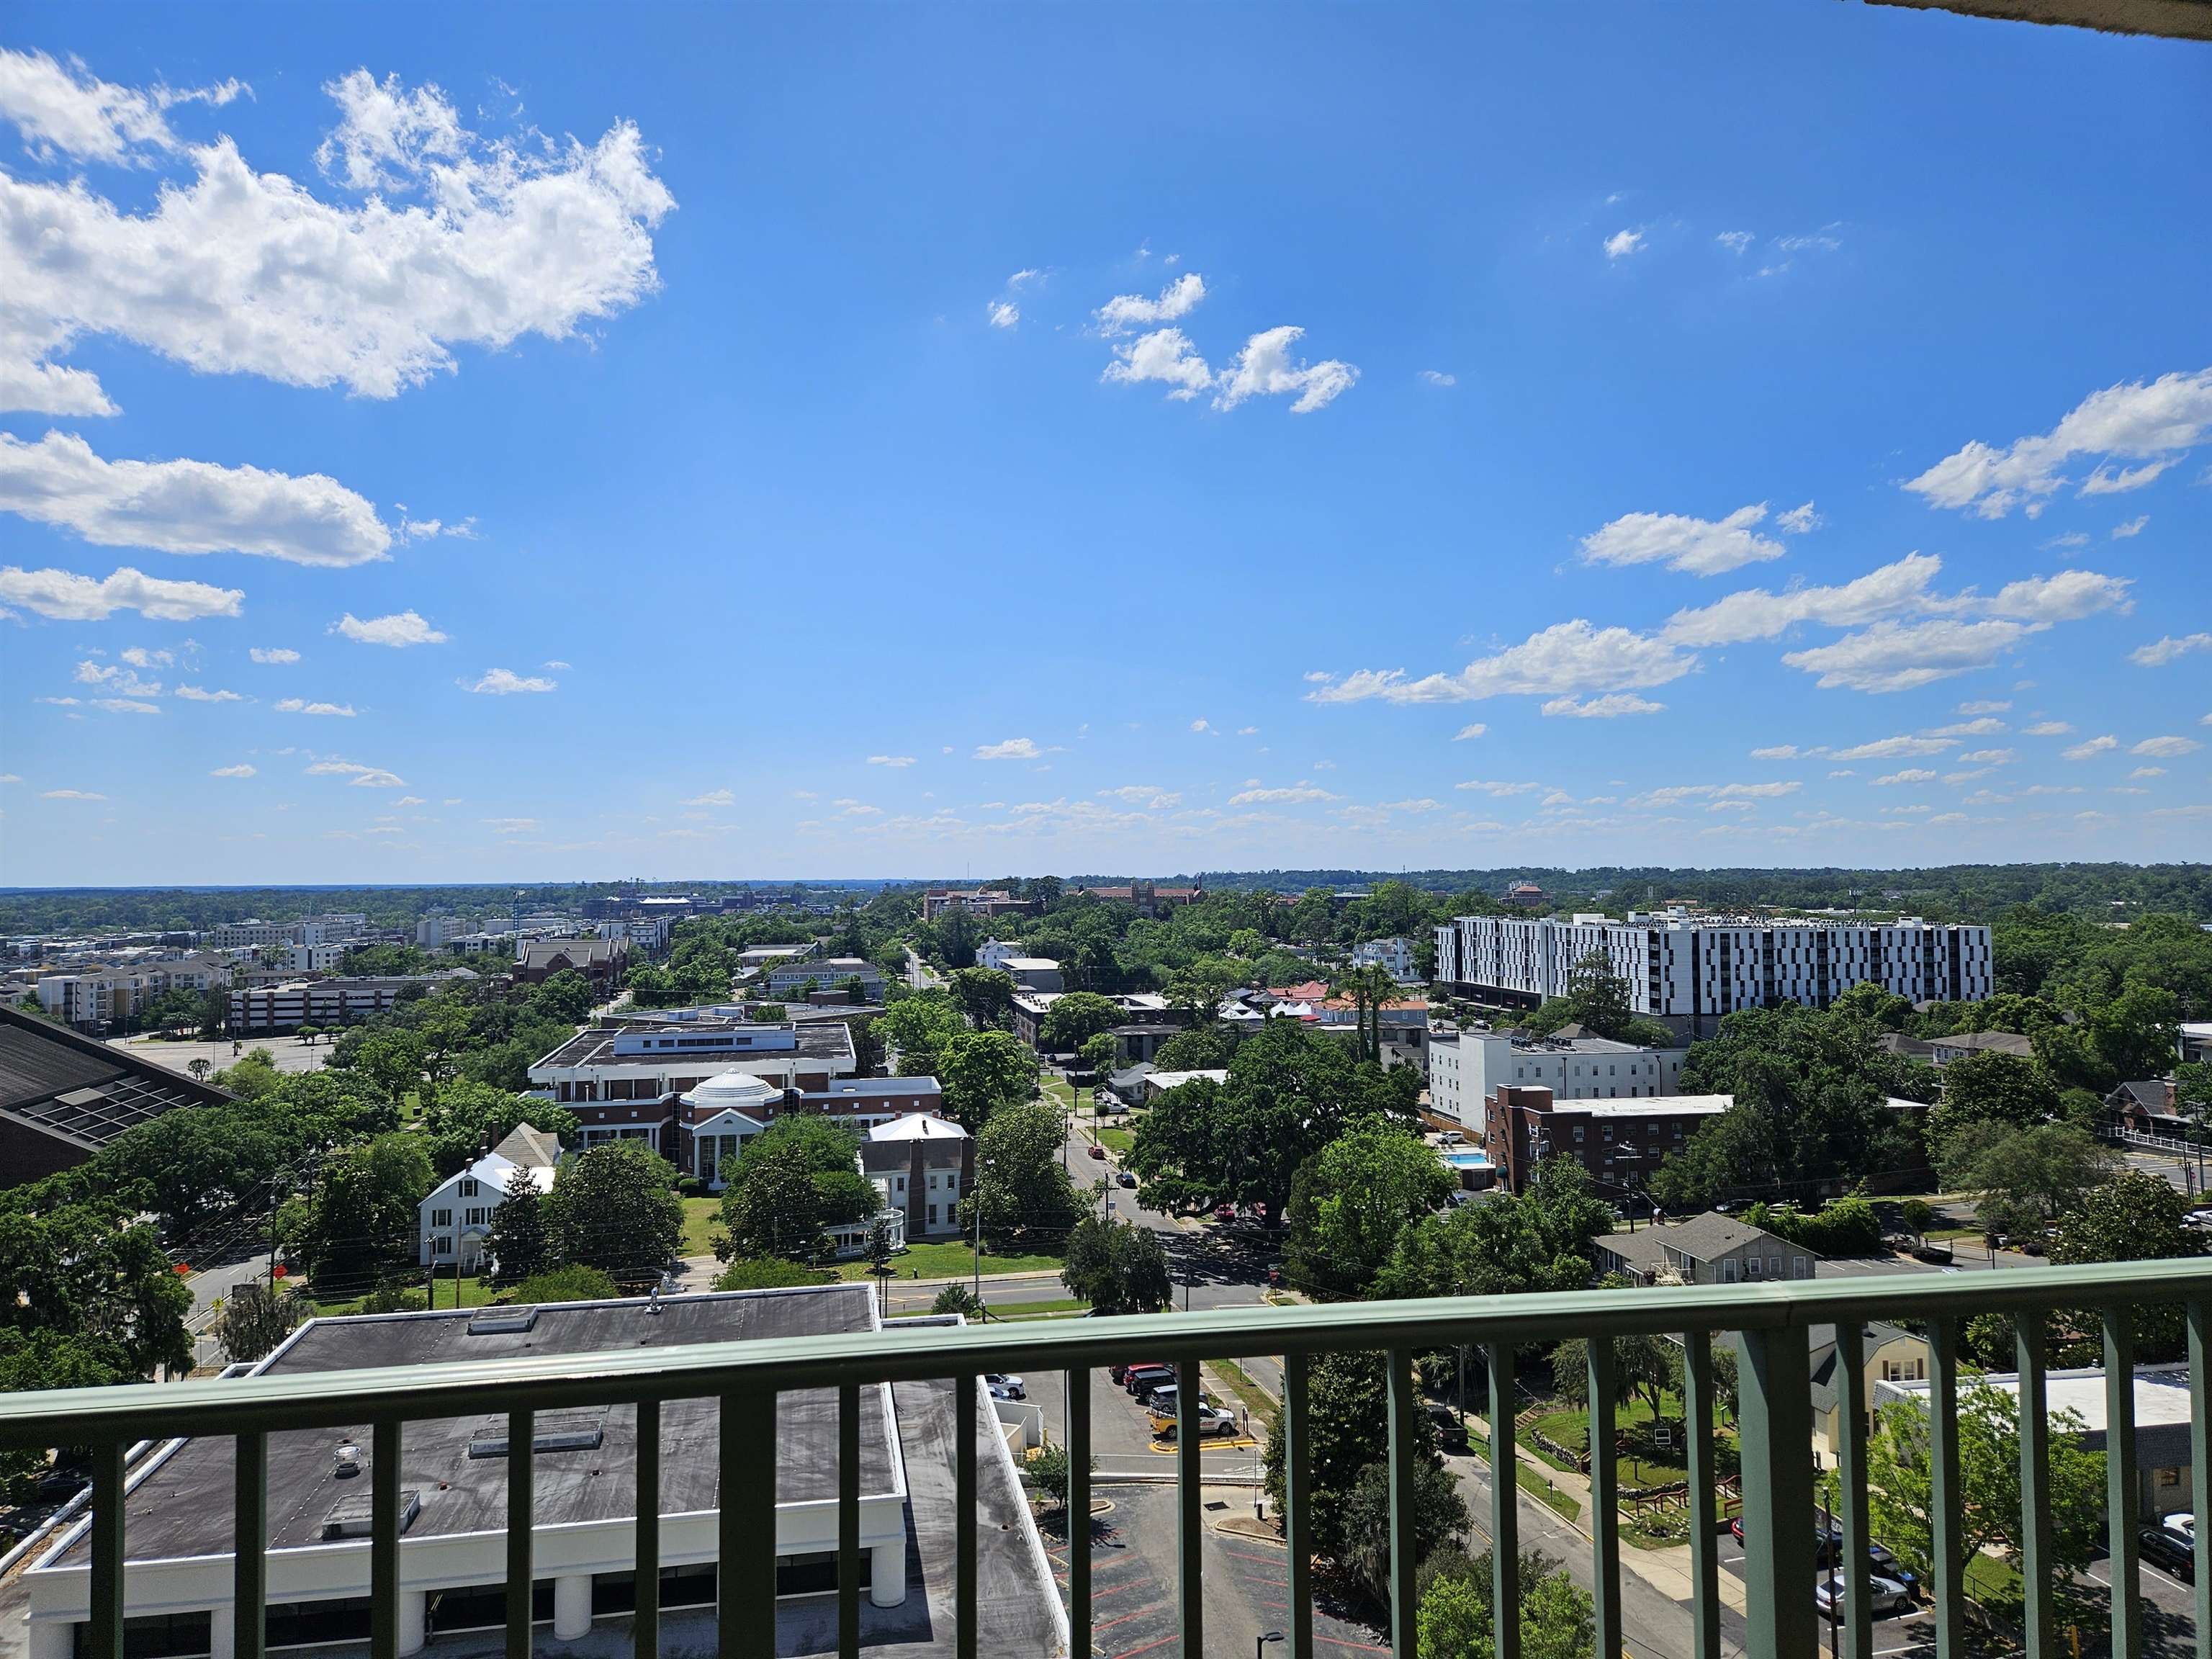
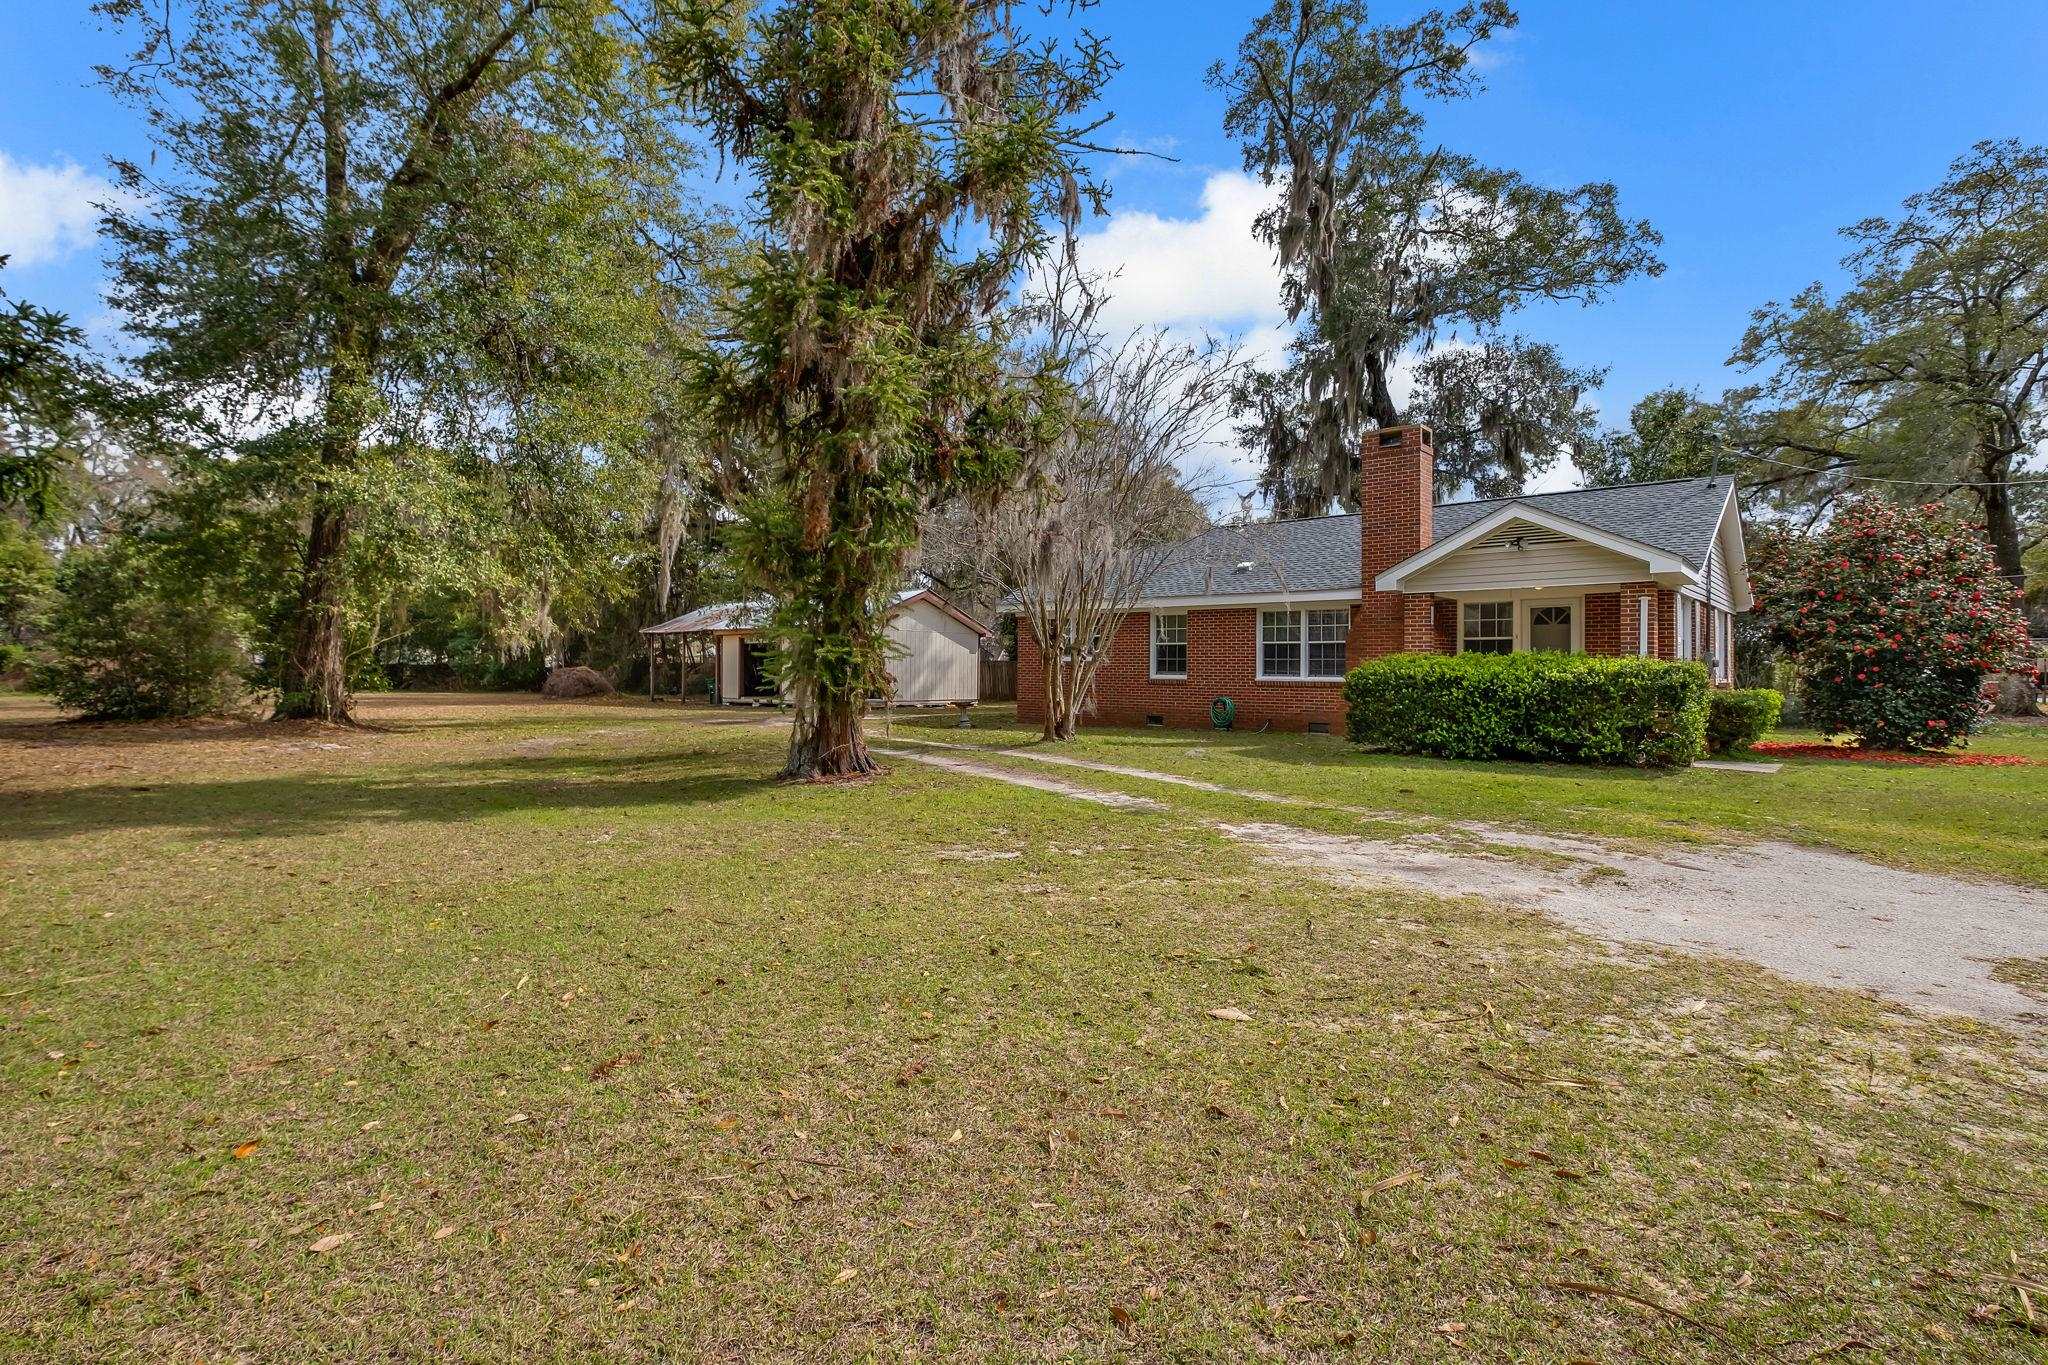
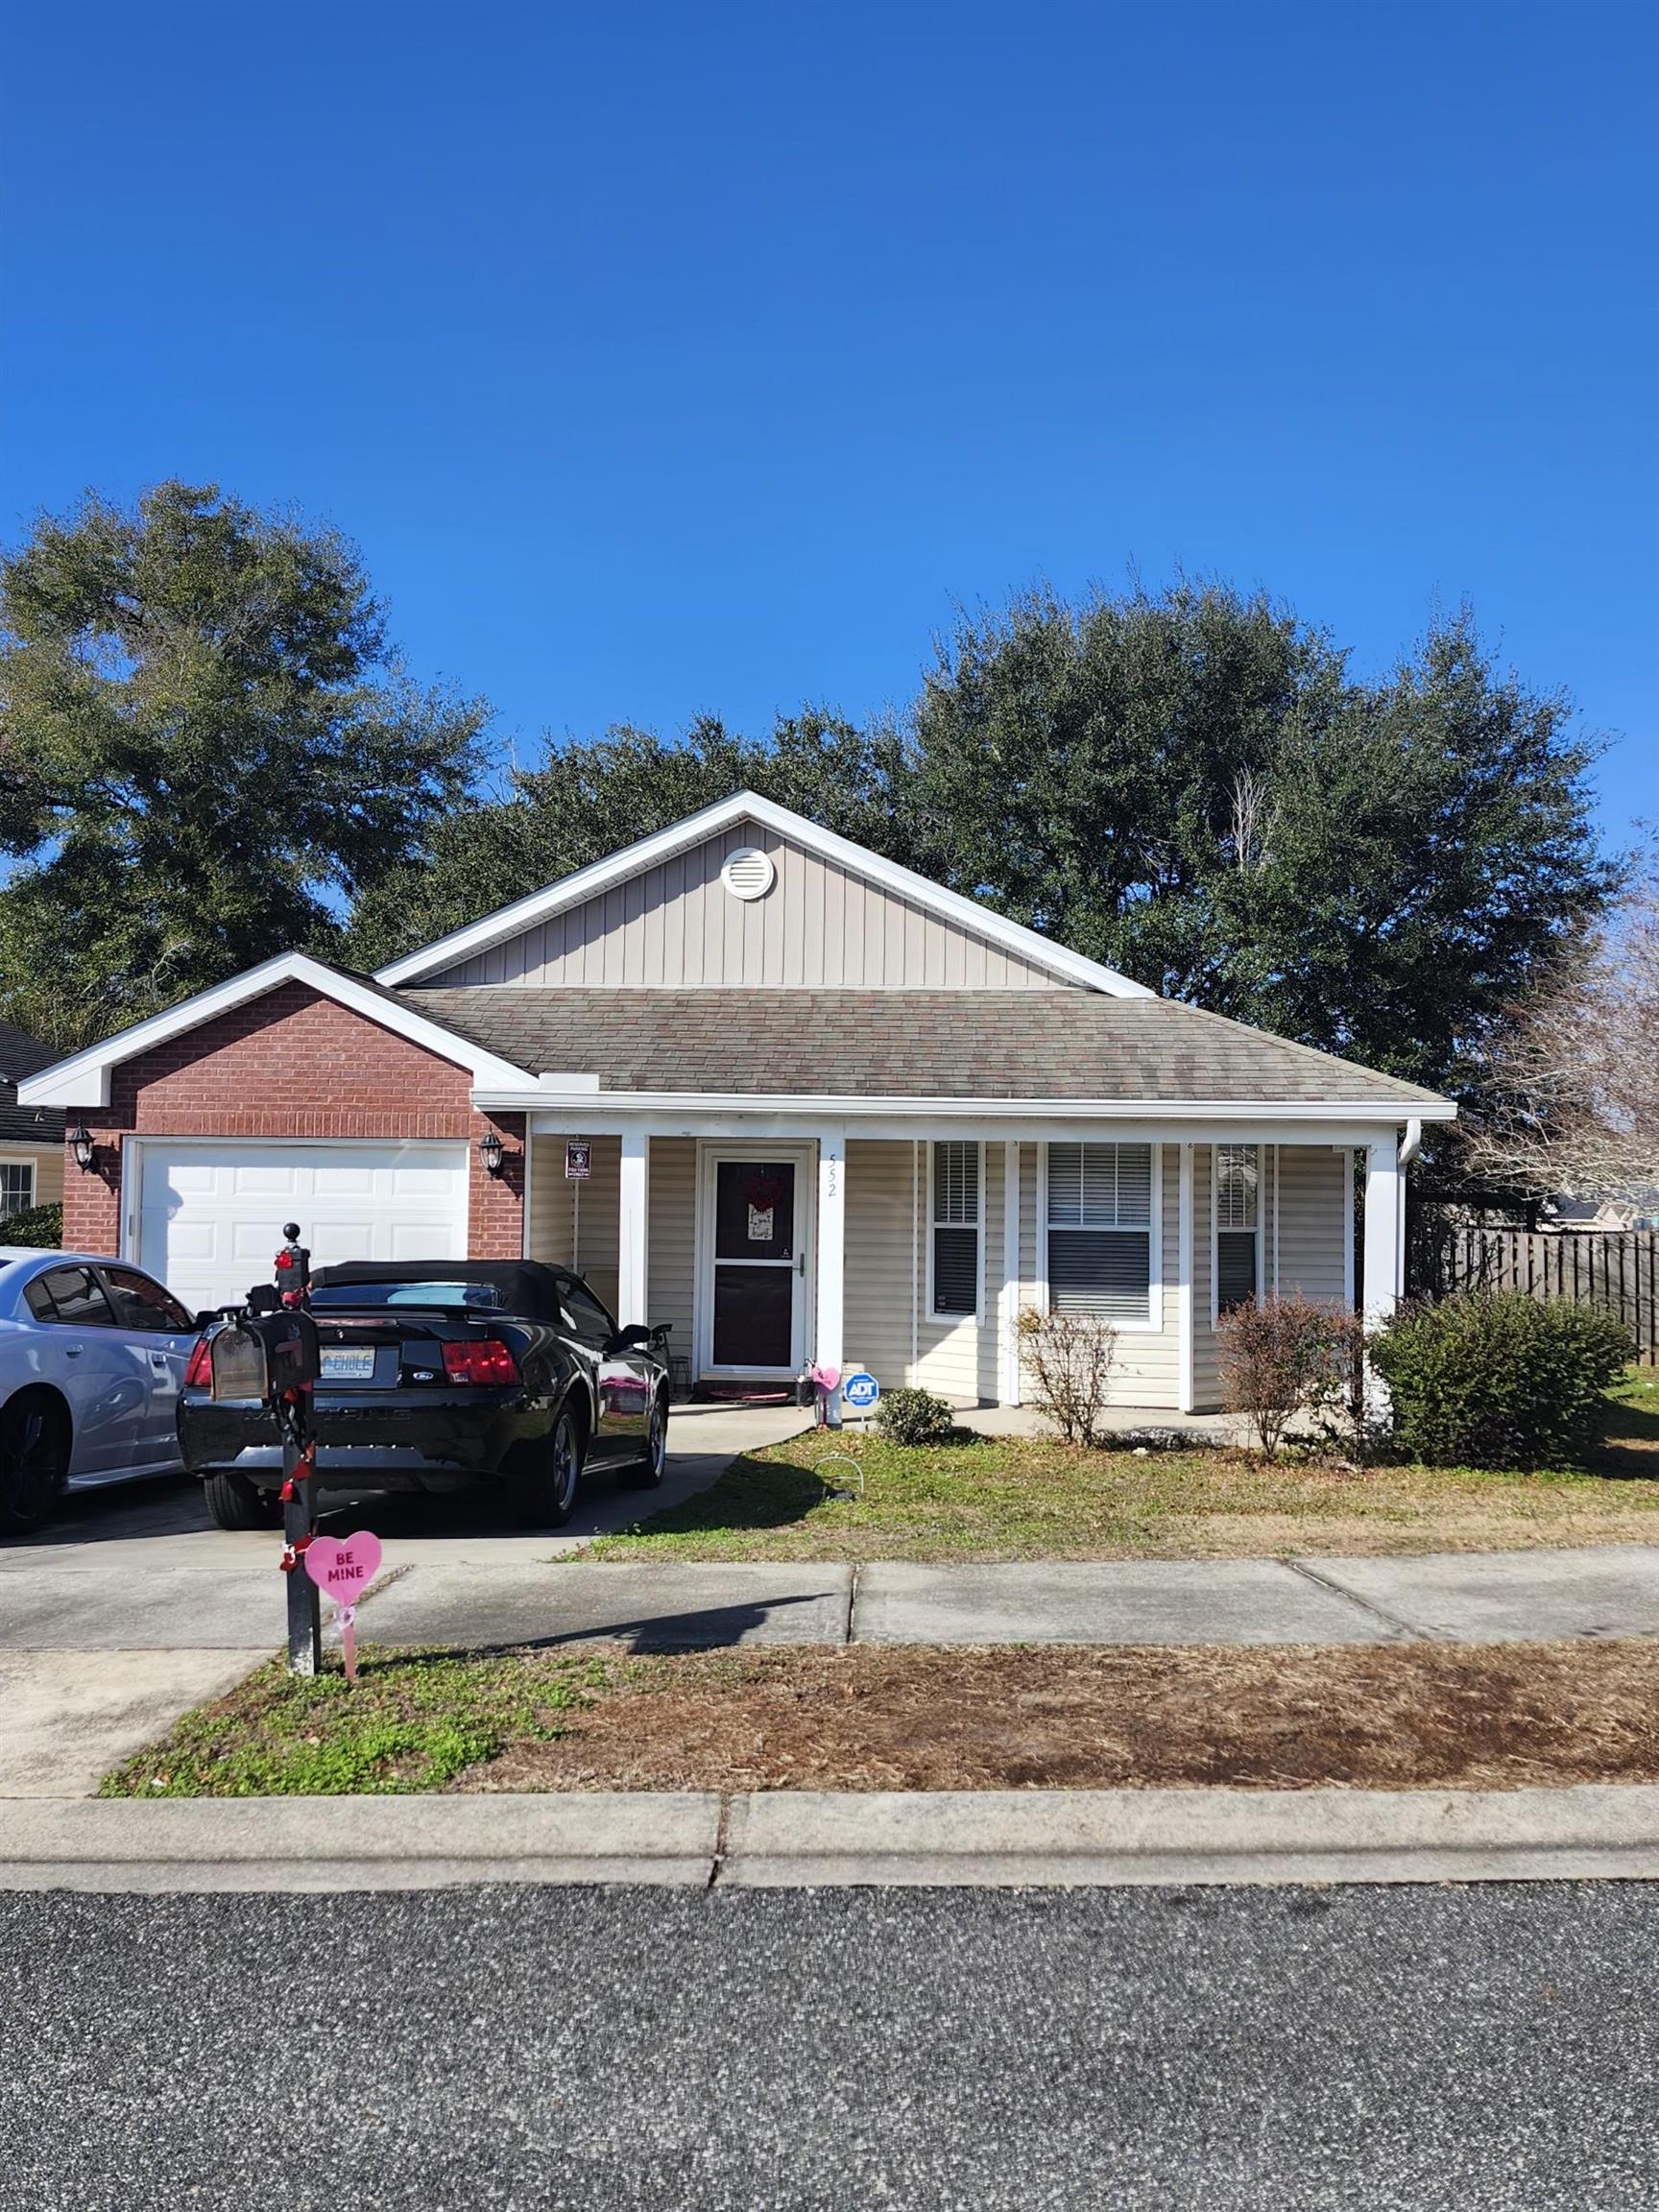
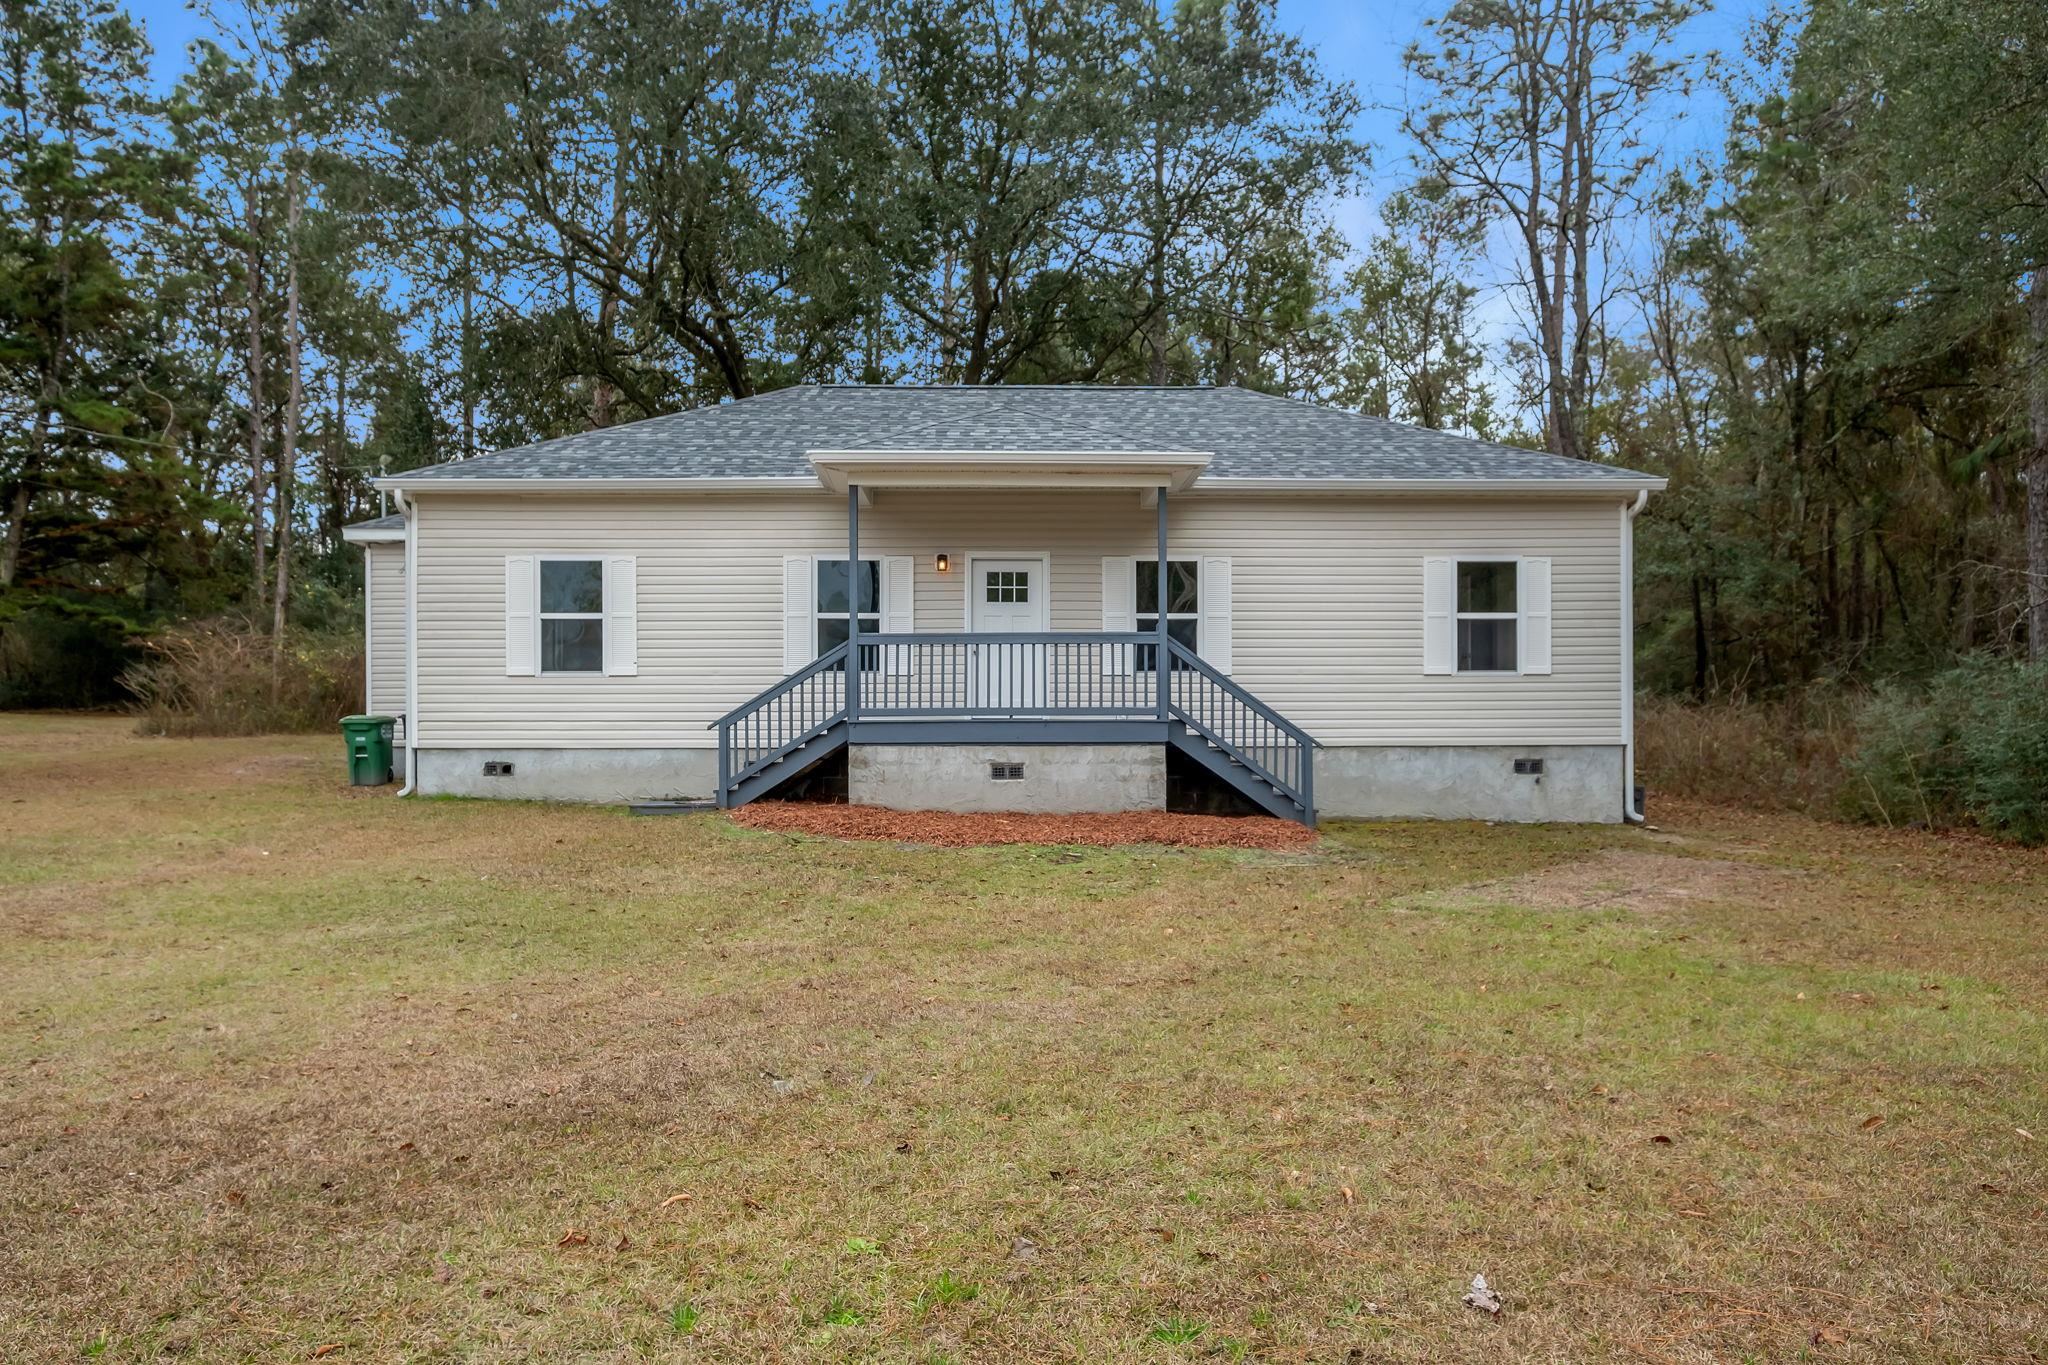
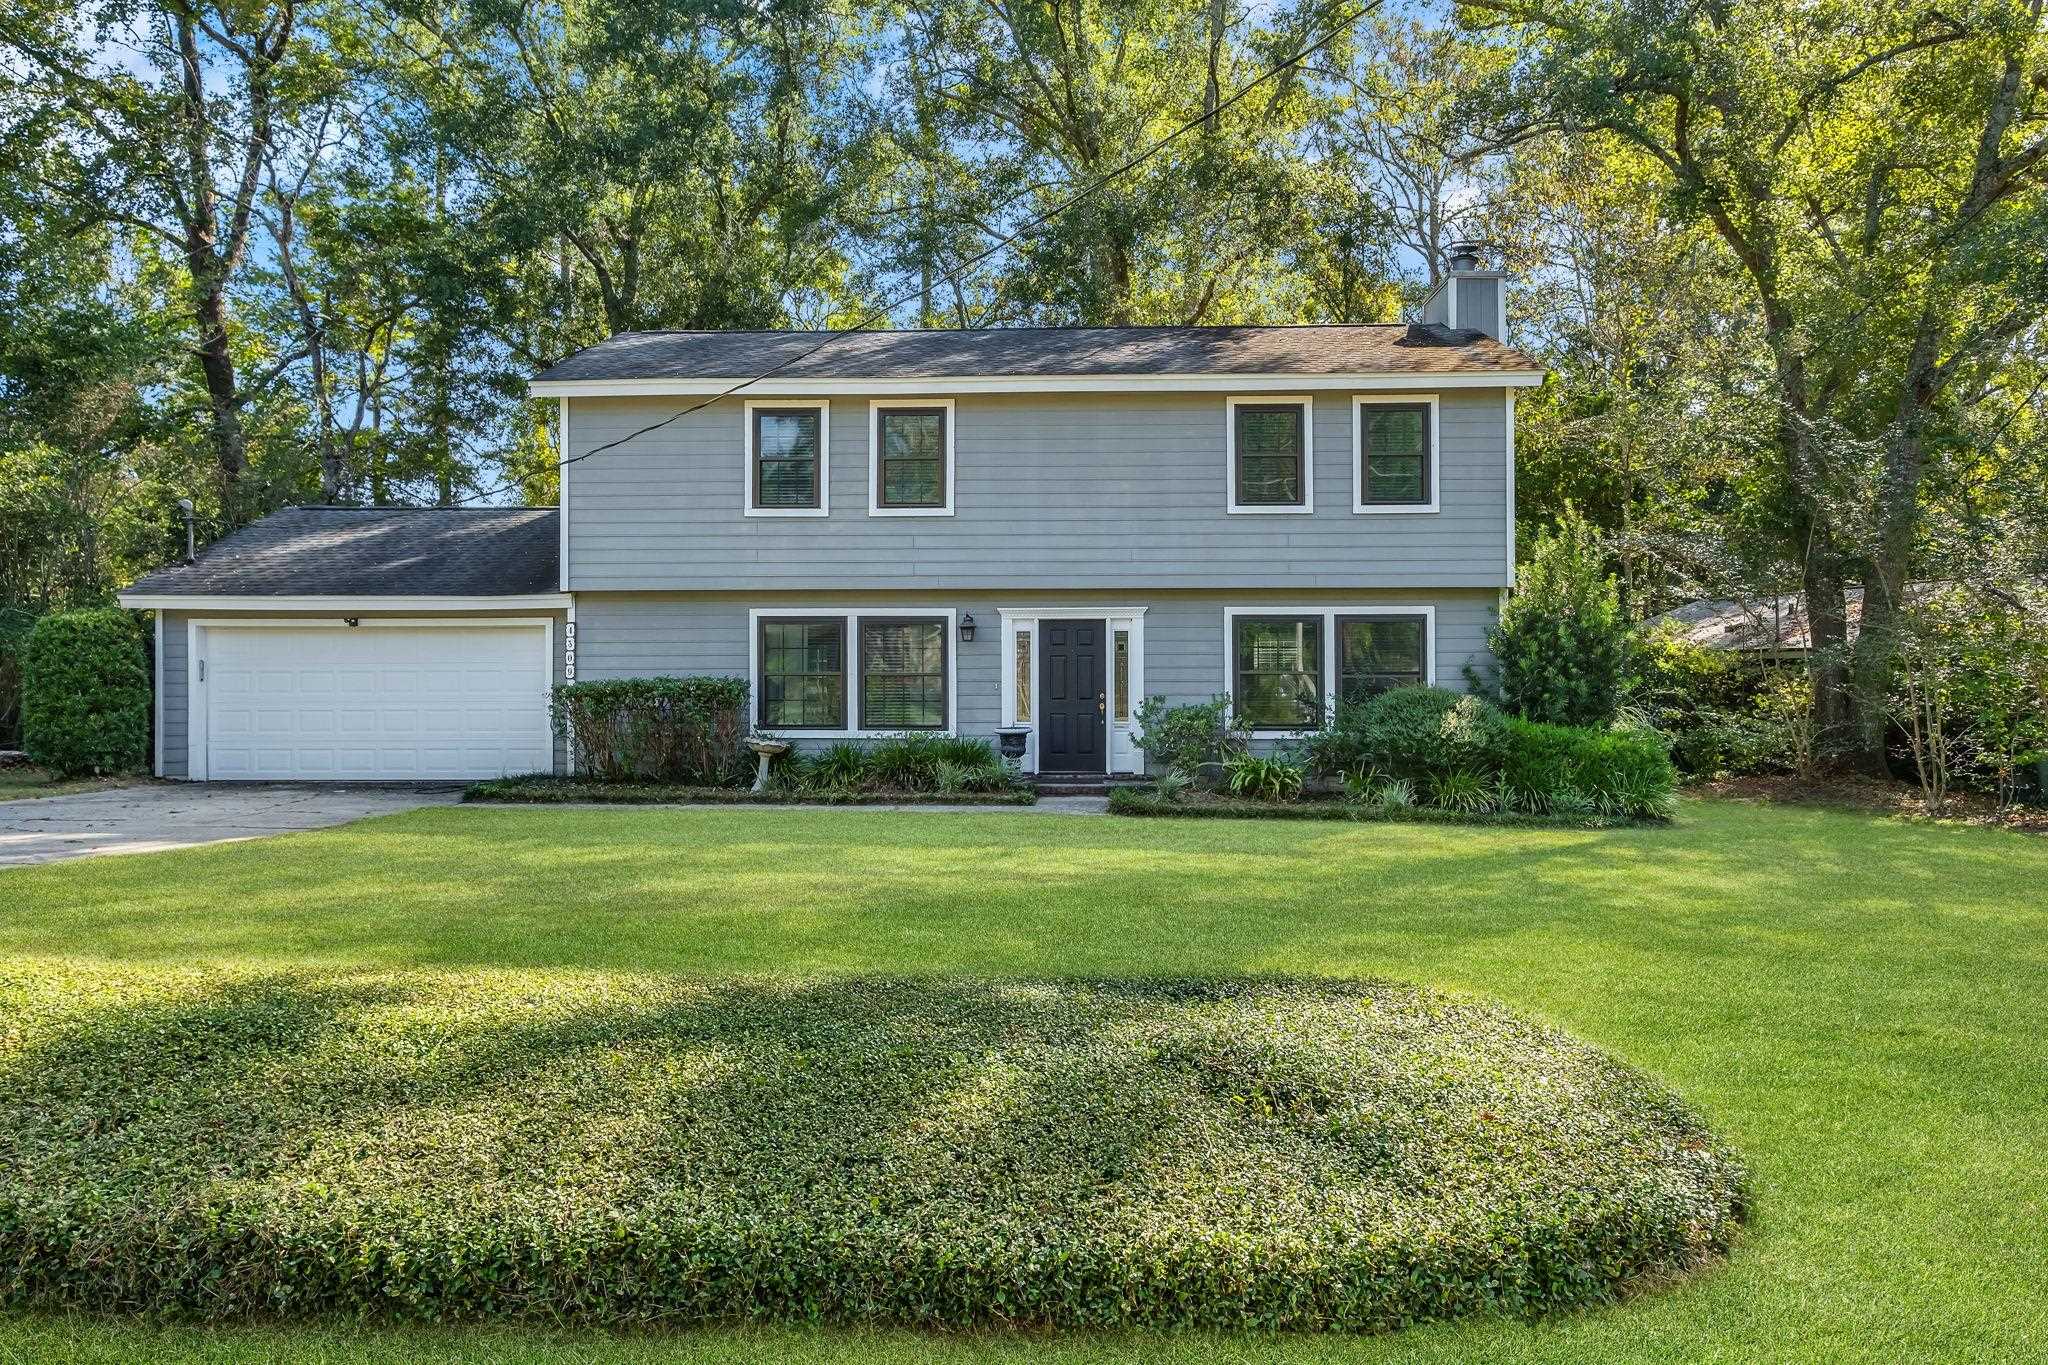
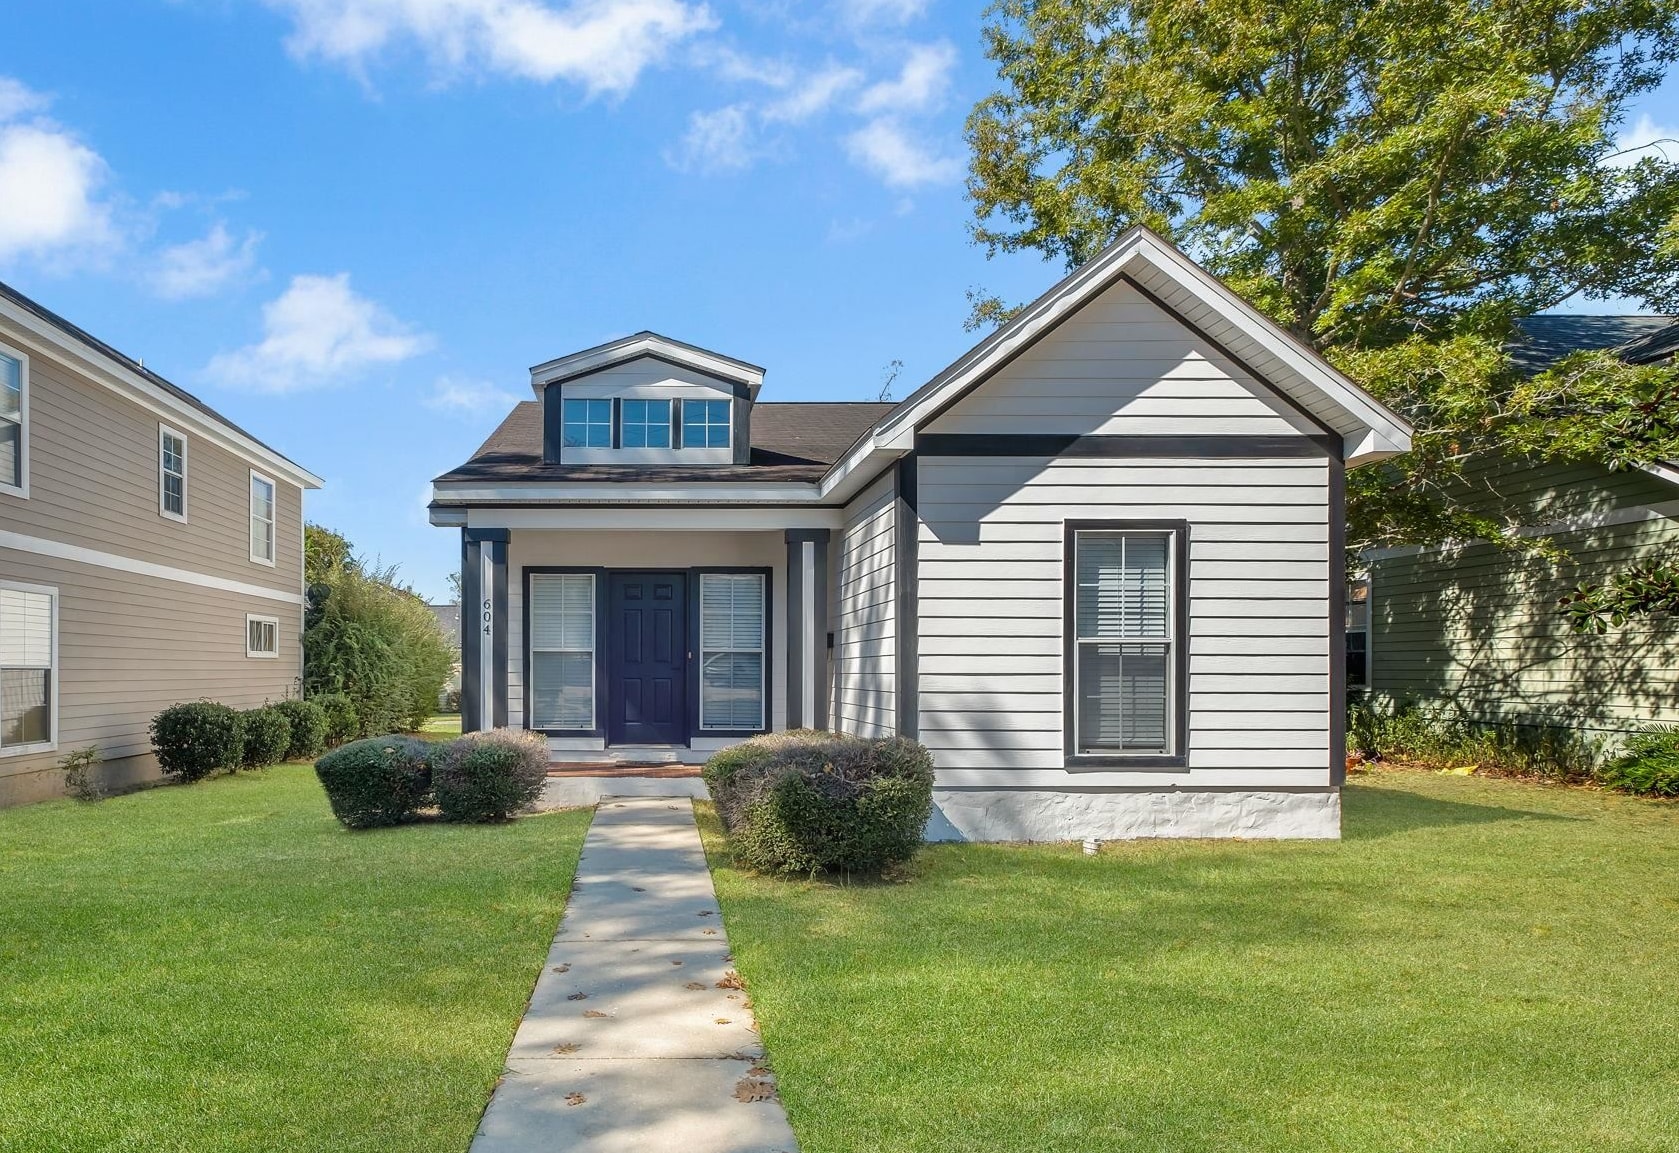
First, we start with a list of all median-priced existing homes for sale in Tallahassee to give our readers an understanding of the home that serves as the basis for today's analysis.

Median-Priced Homes For Sale In Tallahassee

21 Properties
Page 1 of 2

Median Home Price In Tallahassee

In Tallahassee, the median existing-home price is currently $255K, while the median new-home price is 93% higher at $492K. The overall median home price in Tallahassee is $280K.

Our case study examines the investment strategy of purchasing a home when a child is born and selling it to fund college expenses when the child reaches 19. We will base our analysis on the median existing-home price of $255K.

The typical investment loan will cover 80% of the purchase price and we've included an expected 3.5% in closing costs to purchase the property. Here is how that settlement statement would look:

Property Acquisition Report --- Case Study - Buy and Hold (19 Years)

Property Acquisition Report
Case Study - Buy and Hold (19 Years)

This report shows the projected cash requirement for acquisition of the Case Study - Buy and Hold (19 Years) on 1 June 2023.

Cost of Property Acquired
Price of Property $255,000
+ Closing Costs (3.5%) 8,925
Total Cost of Property Acquired $263,925
Property Financing
Loan Loan Principal $204,000
Loan Loan Proceeds $204,000
Total Net Loan Proceeds 204,000
Cash Required at Acquisition $59,925


Selling The Home In 2042

Our analysis assumes we put a home under contract immediately and close on the home on the first of June, 2023. The following report shows how we would convert the house to cash and calculates the tax liability too.

Property Sale Report --- Case Study - Buy and Hold (19 Years)

Property Sale Report
Case Study - Buy and Hold (19 Years)

This report shows the results of a projected sale of the Case Study - Buy and Hold (19 Years) on 31 May 2042. The Sale Price of $718,955 is projected by using a Continuous Growth Rate of 5.607% during the holding period (5.607% is the sixty-year average rate of home price growth in the US through 2022).

Analysis of Sale Proceeds
Sale Price (as discussed above) $718,955
- Costs of Sale (8%) 57,516
- Loan Balances 128,524
- Prepayment Penalties 0
Sale Proceeds Before Tax $532,915
Analysis of Capital Gain Results
Sale Price $718,955
- Capitalized Costs of Sale (100%) 57,516
Net Sale Price for Tax Purposes $661,439
Property Basis at Acquisition $255,000
+ Capitalized Closing Costs (100%) 8,925
+ Capital Additions 0
- Depreciation Taken 146,231
+ Excess Depreciation Recaptured 0
Adjusted Basis at Sale 117,694
Capital Gain (or Loss) $543,745
- Suspended Passive Losses 0
Net Capital Gain (or Loss) $543,745
- Cost Recovery Recaptured 146,231
Adjusted Net Capital Gain (or Loss) $397,514
Cost Recovery Recapture Tax (@ 25%) (36,558)
Tax on Adjusted Net Capital Gain (@ 15%) (59,627)
Expenses Recognized at Sale
Expensed Costs of Sale 0
+ Accrued Loan Interest 0
+ Unamortized Points 0
+ Prepayment Penalties 0
- Excess Depreciation Recaptured 0
Total Expenses Recognized at Sale 0
Tax Savings Due to Sale Expenses (@ 32%) 0
Net Taxable Income $543,745
After Tax Cash Proceeds of Sale $436,730


So the bottom line of the report shows that after taxes, we have grown our investment from $60K to $437K, but there is still a piece missing.

SUCCESSFUL INVESTMENT IS WARFARE!

Investor Booklet

There are fundamental concepts that apply to the real estate investment industry that have also been found true consistently on the battlefield throughout history.

Prudent investors could strengthen their positions by taking a lesson from our military history and doctrine.

This brief paper, assembled by a West Point-educated US Army combat veteran, attempts to explain how investors can alter their strategic plans by using the same analytical techniques as would be applied by our modern warriors.

19 Years Of Ownership

In the first part of this report, we outlined the costs of acquiring a median-priced home in Tallahassee. The second part of the report calculated the after-tax proceeds from the sale. Finally, our last segment presents the property's annual cash flow.

This next segment of our report appears lengthy, but it's just a year-by-year analysis of cash flows that includes a "what if" for a sale each year. Prior to the sales proceeds at the bottom of each year, you will find the "cash flow after tax" section that includes an additional reason for buying a home as an investment.

See if you can spot it before I point it out!

Proforma Income Statement --- Case Study - Buy and Hold (19 Years)

Proforma Income Statement
Case Study - Buy and Hold (19 Years)

This Statement is for the Case Study - Buy and Hold (19 Years) as acquired on 1 June 2023 for a Price of $255,000, subject to a Loan of $204,000, for a Down Payment of $51,000.

7 Months
2023

2024

2025

2026

2027
Total Gross Income $14,000 $24,630 $25,738 $26,897 $28,107
Total Operating Expenses $3,220 $5,665 $8,519 $10,759 $11,243
Net Operating Income $10,780 $18,965 $17,220 $16,138 $16,864
Less: Debt Service 10,073 17,268 17,268 17,268 17,268
Net Operating Cash Flow $707 $1,697 ($48) ($1,130) ($404)
Taxable Income and Taxes
(Losses Carried Forward)
Taxable Revenues $14,000 $24,630 $25,738 $26,897 $28,107
Less: Deducted Expenses 3,220 5,665 8,519 10,759 11,243
Less: Interest Expense 9,012 15,337 15,185 15,021 14,845
Less: Depreciation 4,169 7,696 7,696 7,696 7,696
Ordinary Income ($2,401) ($4,068) ($5,662) ($6,580) ($5,677)
Taxable Income 0 0 0 0 0
(Cum Suspended Losses) 2,401 6,469 12,131 18,711 24,388
Taxes Due (- = Savings) 0 0 0 0 0
Cash Flow After Tax $707 $1,697 ($48) ($1,130) ($404)
Sale Proceeds:
Sale Value $0 $278,006 $293,593 $310,055 $327,440
Less: Sale Costs (8%) 0 22,240 23,487 24,804 26,195
Less: Loan Repayment 0 201,008 198,925 196,678 194,255
Sale Proceeds Before Tax 0 54,758 71,181 88,572 106,990
Less: Taxes due to Sale 0 (415) 3,403 7,175 10,646
Sale Proceeds After Tax 0 55,172 67,778 81,398 96,343


Proforma Income Statement --- Case Study - Buy and Hold (19 Years)

Proforma Income Statement
Case Study - Buy and Hold (19 Years)

This Statement is for the Case Study - Buy and Hold (19 Years) as acquired on 1 June 2023 for a Price of $255,000, subject to a Loan of $204,000, for a Down Payment of $51,000.


2028

2029

2030

2031

2032
Total Gross Income $29,372 $30,693 $32,075 $33,518 $35,026
Total Operating Expenses $11,749 $12,277 $12,830 $13,407 $14,011
Net Operating Income $17,623 $18,416 $19,245 $20,111 $21,016
Less: Debt Service 17,268 17,268 17,268 17,268 17,268
Net Operating Cash Flow $355 $1,148 $1,977 $2,843 $3,748
Taxable Income and Taxes
(Losses Carried Forward)
Taxable Revenues $29,372 $30,693 $32,075 $33,518 $35,026
Less: Deducted Expenses 11,749 12,277 12,830 13,407 14,011
Less: Interest Expense 14,654 14,449 14,227 13,988 13,730
Less: Depreciation 7,696 7,696 7,696 7,696 7,696
Ordinary Income ($4,728) ($3,729) ($2,679) ($1,574) ($411)
Taxable Income 0 0 0 0 0
(Cum Suspended Losses) 29,115 32,844 35,523 37,097 37,508
Taxes Due (- = Savings) 0 0 0 0 0
Cash Flow After Tax $355 $1,148 $1,977 $2,843 $3,748
Sale Proceeds:
Sale Value $345,800 $365,189 $385,665 $407,289 $430,126
Less: Sale Costs (8%) 27,664 29,215 30,853 32,583 34,410
Less: Loan Repayment 191,641 188,822 185,781 182,502 178,964
Sale Proceeds Before Tax 126,495 147,152 169,030 192,204 216,752
Less: Taxes due to Sale 14,395 18,435 22,783 27,455 32,469
Sale Proceeds After Tax 112,100 128,716 146,247 164,749 184,282


Proforma Income Statement --- Case Study - Buy and Hold (19 Years)

Proforma Income Statement
Case Study - Buy and Hold (19 Years)

This Statement is for the Case Study - Buy and Hold (19 Years) as acquired on 1 June 2023 for a Price of $255,000, subject to a Loan of $204,000, for a Down Payment of $51,000.


2033

2034

2035

2036

2037
Total Gross Income $36,603 $38,250 $39,971 $41,770 $43,649
Total Operating Expenses $14,641 $15,300 $15,988 $16,708 $17,460
Net Operating Income $21,962 $22,950 $23,983 $25,062 $26,190
Less: Debt Service 17,268 17,268 17,268 17,268 17,268
Net Operating Cash Flow $4,694 $5,682 $6,715 $7,794 $8,922
Taxable Income and Taxes
(Losses Carried Forward)
Taxable Revenues $36,603 $38,250 $39,971 $41,770 $43,649
Less: Deducted Expenses 14,641 15,300 15,988 16,708 17,460
Less: Interest Expense 13,452 13,153 12,829 12,480 12,104
Less: Depreciation 7,696 7,696 7,696 7,696 7,696
Ordinary Income $813 $2,101 $3,457 $4,885 $6,389
Taxable Income 0 0 0 0 0
(Cum Suspended Losses) 36,695 34,595 31,138 26,252 19,863
Taxes Due (- = Savings) 0 0 0 0 0
Cash Flow After Tax $4,694 $5,682 $6,715 $7,794 $8,922
Sale Proceeds:
Sale Value $454,243 $479,712 $506,610 $535,015 $565,013
Less: Sale Costs (8%) 36,339 38,377 40,529 42,801 45,201
Less: Loan Repayment 175,149 171,033 166,594 161,807 156,643
Sale Proceeds Before Tax 242,755 270,302 299,487 330,407 363,169
Less: Taxes due to Sale 37,844 43,597 49,752 56,329 63,351
Sale Proceeds After Tax 204,911 226,704 249,735 274,078 299,818


Proforma Income Statement --- Case Study - Buy and Hold (19 Years)

Proforma Income Statement
Case Study - Buy and Hold (19 Years)

This Statement is for the Case Study - Buy and Hold (19 Years) as acquired on 1 June 2023 for a Price of $255,000, subject to a Loan of $204,000, for a Down Payment of $51,000.


2038

2039

2040

2041
5 Months
2042
Total Gross Income $45,613 $47,666 $49,811 $52,052 $22,085
Total Operating Expenses $18,245 $19,066 $19,924 $20,821 $8,834
Net Operating Income $27,368 $28,600 $29,887 $31,231 $13,251
Less: Debt Service 17,268 17,268 17,268 17,268 7,195
Net Operating Cash Flow $10,100 $11,332 $12,619 $13,963 $6,056
Taxable Income and Taxes
(Losses Carried Forward)
Taxable Revenues $45,613 $47,666 $49,811 $52,052 $22,085
Less: Deducted Expenses 18,245 19,066 19,924 20,821 8,834
Less: Interest Expense 11,698 11,260 10,788 10,279 4,123
Less: Depreciation 7,696 7,696 7,696 7,696 3,528
Ordinary Income $7,974 $9,643 $11,402 $13,256 $5,600
Taxable Income 0 0 9,156 13,256 5,600
(Cum Suspended Losses) 11,890 2,247 0 0 0
Taxes Due (- = Savings) 0 0 2,930 4,242 1,792
Cash Flow After Tax $10,100 $11,332 $9,689 $9,721 $4,264
Sale Proceeds:
Sale Value $596,694 $630,150 $665,483 $702,797 $718,955
Less: Sale Costs (8%) 47,736 50,412 53,239 56,224 57,516
Less: Loan Repayment 151,073 145,065 138,585 131,596 128,524
Sale Proceeds Before Tax 397,886 434,673 473,659 514,978 532,915
Less: Taxes due to Sale 70,843 78,895 86,032 93,105 96,185
Sale Proceeds After Tax 327,043 355,778 387,628 421,872 436,730


Benefits Of Real Estate Investment

So many people are peddling real estate investment courses online that it's easy to get confused about wise investment strategies. Unless you are looking for a job, the safest way to invest in real estate is a "buy and hold" approach. As soon as you hear the term "flipping," run away! While people can make good money flipping homes, they aren't doing it passively.

Flipping real estate is a job, and you'll compete with other people who do it full-time. But a long-term hold investment, where you own real estate for years without selling, is something you can do passively by hiring a property manager to handle the operation of the property.

You gain very strong returns by leveraging, which means using borrowed money, such as a mortgage, to purchase a property with the expectation that the property's value will increase over time. The goal of leveraging is to increase the potential return on investment by using other people's money to fund the purchase. In this investment study, we used $59,925 to control a $255,000 asset that grew by 5.6% annually. Instead of gaining a 5.6% annual return, we were able to convert that to an after-tax return of more than 13% using leverage.

Keep Up With New Trends In Tallahassee!

Get The Tallahassee Real Estate Newsletter

Subscribe to the Tallahassee Real Estate Newsletter for updates on home sales in Tallahassee, FloridaDon't be the one that doesn't know what's going on when you sell a home or buy a home in Tallahassee.

Other buyers, sellers, lenders, and real estate agents have this critical information, and now you can too!

Get immediate access to our most recent newsletter.

Let more than 30 years of experience work for you with charts, graphs, and analysis of the Tallahassee housing market.

Do You Hate Paying Taxes?

Our report's final segment is for readers who hate paying taxes! Like the annual statement above, this breaks down the cash flow for each year of ownership, and it reveals how your real estate investment can return some of your tax dollars. As you go through the numbers in the report below, take note that I've highlighted my favorite line-item (it's the reason we get some of our tax dollars returned).

Real Estate Investment Analysis --- Case Study - Buy and Hold (19 Years)
Real Estate Investment Analysis
Case Study - Buy and Hold (19 Years)

Buy 2023 2024 2025
Before Tax Cash Flow Projection
Investment and Sale (263,925) 0 0 0
Effective Income 0 14,000 24,630 25,738
Operating Expense 0 (3,220) (5,665) (8,519)
Cash Flow Before Debt (263,925) 10,780 18,965 17,220
Debt Service 204,000 (10,073) (17,268) (17,268)
Cash Flow Before Tax (59,925) 707 1,697 (48)
Taxable Income Projection
Taxable Revenue 0 14,000 24,630 25,738
Taxable Expense 0 (3,220) (5,665) (8,519)
Interest Expense 0 (9,012) (15,337) (15,185)
Depreciation 0 (4,169) (7,696) (7,696)
Ordinary Income 0 (2,401) (4,068) (5,662)
After Tax Cash Flow Projection
Cash Flow Before Tax (59,925) 707 1,697 (48)
Ordinary Income 0 (2,401) (4,068) (5,662)
Capital Gains 0 0 0 0
Taxable Income 0 0 0 0
Taxes 0 0 0 0
Cash Flow After Tax (59,925) 707 1,697 (48)

Rate of Return Before Debt (IRR) 10.9%
Rate of Return Before Tax (IRR) 14.4%
Rate of Return After Tax (IRR) 13.3%
Net Present Value Before Debt @6% 197,058
Net Present Value Before Tax @6% 160,177
Net Present Value After Tax @6% 125,234


Real Estate Investment Analysis --- Case Study - Buy and Hold (19 Years)
Real Estate Investment Analysis
Case Study - Buy and Hold (19 Years)

2026 2027 2028 2029
Before Tax Cash Flow Projection
Investment and Sale 0 0 0 0
Effective Income 26,897 28,107 29,372 30,693
Operating Expense (10,759) (11,243) (11,749) (12,277)
Cash Flow Before Debt 16,138 16,864 17,623 18,416
Debt Service (17,268) (17,268) (17,268) (17,268)
Cash Flow Before Tax (1,130) (404) 355 1,148
Taxable Income Projection
Taxable Revenue 26,897 28,107 29,372 30,693
Taxable Expense (10,759) (11,243) (11,749) (12,277)
Interest Expense (15,021) (14,845) (14,654) (14,449)
Depreciation (7,696) (7,696) (7,696) (7,696)
Ordinary Income (6,580) (5,677) (4,728) (3,729)
After-Tax Cash Flow Projection
Cash Flow Before Tax (1,130) (404) 355 1,148
Ordinary Income (6,580) (5,677) (4,728) (3,729)
Capital Gains 0 0 0 0
Taxable Income 0 0 0 0
Taxes 0 0 0 0
Cash Flow After Tax (1,130) (404) 355 1,148


Real Estate Investment Analysis --- Case Study - Buy and Hold (19 Years)
Real Estate Investment Analysis
Case Study - Buy and Hold (19 Years)

2030 2031 2032 2033
Before Tax Cash Flow Projection
Investment and Sale 0 0 0 0
Effective Income 32,075 33,518 35,026 36,603
Operating Expense (12,830) (13,407) (14,011) (14,641)
Cash Flow Before Debt 19,245 20,111 21,016 21,962
Debt Service (17,268) (17,268) (17,268) (17,268)
Cash Flow Before Tax 1,977 2,843 3,748 4,694
Taxable Income Projection
Taxable Revenue 32,075 33,518 35,026 36,603
Taxable Expense (12,830) (13,407) (14,011) (14,641)
Interest Expense (14,227) (13,988) (13,730) (13,452)
Depreciation (7,696) (7,696) (7,696) (7,696)
Ordinary Income (2,679) (1,574) (411) 813
After-Tax Cash Flow Projection
Cash Flow Before Tax 1,977 2,843 3,748 4,694
Ordinary Income (2,679) (1,574) (411) 813
Capital Gains 0 0 0 0
Taxable Income 0 0 0 0
Taxes 0 0 0 0
Cash Flow After Tax 1,977 2,843 3,748 4,694


Real Estate Investment Analysis --- Case Study - Buy and Hold (19 Years)
Real Estate Investment Analysis
Case Study - Buy and Hold (19 Years)

2034 2035 2036 2037
Before Tax Cash Flow Projection
Investment and Sale 0 0 0 0
Effective Income 38,250 39,971 41,770 43,649
Operating Expense (15,300) (15,988) (16,708) (17,460)
Cash Flow Before Debt 22,950 23,983 25,062 26,190
Debt Service (17,268) (17,268) (17,268) (17,268)
Cash Flow Before Tax 5,682 6,715 7,794 8,922
Taxable Income Projection
Taxable Revenue 38,250 39,971 41,770 43,649
Taxable Expense (15,300) (15,988) (16,708) (17,460)
Interest Expense (13,153) (12,829) (12,480) (12,104)
Depreciation (7,696) (7,696) (7,696) (7,696)
Ordinary Income 2,101 3,457 4,885 6,389
After-Tax Cash Flow Projection
Cash Flow Before Tax 5,682 6,715 7,794 8,922
Ordinary Income 2,101 3,457 4,885 6,389
Capital Gains 0 0 0 0
Taxable Income 0 0 0 0
Taxes 0 0 0 0
Cash Flow After Tax 5,682 6,715 7,794 8,922


Real Estate Investment Analysis --- Case Study - Buy and Hold (19 Years)
Real Estate Investment Analysis
Case Study - Buy and Hold (19 Years)

2038 2039 2040 2041
Before Tax Cash Flow Projection
Investment and Sale 0 0 0 0
Effective Income 45,613 47,666 49,811 52,052
Operating Expense (18,245) (19,066) (19,924) (20,821)
Cash Flow Before Debt 27,368 28,600 29,887 31,231
Debt Service (17,268) (17,268) (17,268) (17,268)
Cash Flow Before Tax 10,100 11,332 12,619 13,963
Taxable Income Projection
Taxable Revenue 45,613 47,666 49,811 52,052
Taxable Expense (18,245) (19,066) (19,924) (20,821)
Interest Expense (11,698) (11,260) (10,788) (10,279)
Depreciation (7,696) (7,696) (7,696) (7,696)
Ordinary Income 7,974 9,643 11,402 13,256
After-Tax Cash Flow Projection
Cash Flow Before Tax 10,100 11,332 12,619 13,963
Ordinary Income 7,974 9,643 11,402 13,256
Capital Gains 0 0 0 0
Taxable Income 0 0 9,156 13,256
Taxes 0 0 (2,930) (4,242)
Cash Flow After Tax 10,100 11,332 9,689 9,721


Real Estate Investment Analysis --- Case Study - Buy and Hold (19 Years)
Real Estate Investment Analysis
Case Study - Buy and Hold (19 Years)

2042 Sell Total
Before Tax Cash Flow Projection
Investment and Sale 0 661,439 397,514
Effective Income 22,085 0 697,525
Operating Expense (8,834) 0 (270,667)
Cash Flow Before Debt 13,251 661,439 824,372
Debt Service (7,195) (128,524) (252,616)
Cash Flow Before Tax 6,056 532,915 571,757
Taxable Income Projection
Taxable Revenue 22,085 0 697,525
Taxable Expense (8,834) 0 (270,667)
Interest Expense (4,123) 0 (252,616)
Depreciation (3,528) 0 (146,231)
Ordinary Income 5,600 0 28,012
After-Tax Cash Flow Projection
Cash Flow Before Tax 6,056 532,915 571,757
Ordinary Income 5,600 0 28,012
Capital Gains 0 543,745 543,745
Taxable Income 5,600 543,745 571,757
Taxes (1,792) (96,185) (105,149)
Cash Flow After Tax 4,264 436,730 466,608


Depreciation Is A Real Tax Breaker

Did you know the IRS lets you write off (meaning "reduce your taxable income") depreciation?

According to the IRS, depreciation for residential real estate investment is deducting a property's cost over a specified period for tax purposes. It's an allowance for the property's wear and tear, deterioration, or obsolescence that occurs over time. The IRS allows real estate investors to depreciate residential rental properties over 27.5 years, which means investors can deduct a portion of the property's value each year as an expense on their tax return. The depreciation deduction can help reduce the investor's taxable income and lower their overall tax liability.

The case study example includes an annual write-off of $7,696 for depreciation. This is not money you've spent; rather, it's an amount of "loss in value" that the government expects on your property. So even as your property value grows, the government lets you write off a loss! If you hate paying taxes, then depreciation will become your new best friend!

In the previous report, two lines will help you understand the benefit of the depreciation write-off, and I've highlighted them in aqua.

The first is "cash flow before tax," which is the amount of money your property manager sends you, and the second line is "Ordinary Income." Your taxes are based upon ordinary income, and you can see (thanks to depreciation) your ordinary income is negative until 2033. Your first ten years put tax dollars back in your pocket, and the final nine years have you paying lower taxes than you would if you received the income from another type of investment.

Depreciation is a valuable tool that real estate investors can use to reduce their taxable income and lower their tax liability. Overall, by taking advantage of depreciation, real estate investors can enjoy increased cash flow before tax and reduced ordinary income tax liability, making it an attractive investment option for those looking to build long-term wealth (or send their child to school).

So, should you buy a house for your child? Absolutely, and buy a few for yourself too!

Smart Real Estate Is Boring

When choosing homes for investment, there's safety in the middleOne thing I explain to young investors all the time is that smart real estate investing (buy and hold) is boring!

The type of property you should target is boring! If you are excited about a property you are about to buy, you’re probably making a mistake. Great long-term hold investments are just regular houses in the right areas. Nothing sexy, nothing crazy; go out and buy houses where the middle class wants to live.

The safest place to be in the housing market is the middle. Should any market correction come around in the future, the homes that stay occupied are the ones in the middle.

Low-end units often have relatively high rents, high vacancy rates, and collection issues (compounded with higher turnover costs between tenants).

High-end units often have relatively low rents and are the first to go vacant in an economic turndown.

Buying homes in the two middle quartiles of any housing market is the safest way to ensure a long-term investment in the housing market.

If you want to learn more about a smart, long-term, residential buy-and-hold investment plan, just let us know how to reach you, and we'll be in touch immediately!

Want To Learn More About Real Estate Investing?


This site is protected by reCAPTCHA and the Google Privacy Policy and Terms of Service apply.
Zillow Drops Bombshell Real Estate Update
You won't want to miss the latest data release from Zillow. They've just dropped a bombshell of a report that will significantly impact the housing market.
How Bad Is It? SHOCKING Building Permits Report!
The lack of home affordability has become a widely discussed issue in the media - the shortfall in new single-family home permits and multi-family property permits and construction exacerbates the current housing crisis.
Will New Construction Bottleneck Cause A New Housing Bubble?
Are you concerned that the bottleneck of builder homes under construction will cause a new housing bubble as they are finally completed?
Google Knows. The Surprising Real Estate Market Forecast You Won't Believe!
Is it possible to forecast home sales in the US housing market with a search on Google? I had this thought about Google and a google housing market forecast as I was reexamining our search engine optimization efforts.
The Truth About Foreclosures - Mortgage Pipeline Update
The best way to start to analyze the potential for mass foreclosures is to break down the current mortgage pipeline to observe forming trends.
Renter Nation Says Goodbye To The American Dream!
It's the beginning of a generational shift in the housing market that will greatly reduce homeownership and push the US towards becoming a renter nation, one in which Wall Street is in control of both home prices and rents
The Surprising Way Interest Rates Move The Market
When mortgage interest rates change, housing market experts surface and make bold claims on how the market will unfold. They are usually wrong!
Home Affordability Falls To 40-Year Low!
It's been over forty years since homes were more expensive than today when you factor in inflation, home prices, and mortgage interest rates.
Biden Rent Control Plan
The White House announced an executive action that Biden says is designed to "protect renters and promote rental affordability," but I cannot imagine a worse response from our Commander In Chief to confront the nation's housing and rental affordability crisis
Market Equilibrium, How The Balance Has Changed In Real Estate
The way we estimate housing market equilibrium has changed, and with it, the way the market is evaluated must change.
What You Don't Know About Home Prices!
Home prices are gaining traction as topics in both the mainstream media and social media, but there are three common misconceptions about the change in house prices that are unanimously reported as unquestionably true.
New Home Construction Report
Kevin Erdmann Housing Update September 2022 - Explains the new home construction pipeline and what to know about the number of homes being built in the US.
Home Prices Are Doing What?
The hype-headlines are scary, exclaiming falling home prices and the coming housing market crash. Here's what the housing market facts reveal:
REDFIN Reports Falling Home Prices?
Does the latest Redfin real estate report show home prices falling? I reviewed the Redfin real estate data, but did I find home prices dropping?
Unlocking Zillow's Latest Housing Trends And Forecasts
Zillow has shared its extensive data that we have used to generate our monthly housing market update. Zillow reports this right now:
House Prices - Inflation Adjusted Home Prices
Just How High Are Today's House Prices? The price of houses in the US has risen to a toxic level, and many are wondering how they will be able to afford to live in their local communities
USA Today Misleads Readers About Home Prices
USA Today Misleads Readers About Home Prices - Median Home Price: The USA Today Network has been misleading readers, using the median home price change suggesting that houses are getting cheaper and a real estate crash is upon us. Is this poor journalism or is there something more to it?
Economic Outlook For The Housing Market
Joe Manausa gives an update on the economic outlook for Tallahassee and the US housing market. Includes housing market forecast, housing market activity, and new construction analysis, and reveals how Tallahassee compares with the overall US housing market.
Podcast: Housing Myths Dispelled
Home Building Hero David Belman and Joe Manausa discuss many of the "myths" that have been published in the media about the housing market.
Are Wages Keeping Up With Rising Home Prices
Home prices are rising. Mortgage interest rates are rising. Are people earning enough money to buy homes today, or is the home affordability crisis getting worse?
Zillow - Surprising Home Sales Report
Zillow has something to say about the housing market. Zillow's data suggests something else is happening. And it’s not just Zillow.
Zillow Exposes Mainstream Media On Home Prices
Zillow serves up the data that exposes the poor reporting of the mainstream media on Zillow home prices and that conditions are not what they seem.
Housing - Do You Follow Your Gut (Or Analytics) In Housing?
I think the signs in the housing market are loud and clear, yet most real estate reports I read or view are missing the most critical factor in housing today.
6 Housing Market Rumors Debunked (1 Confirmed)
7 different housing market rumors are perpetuated as “FACT” in various forms of "hype." Discussion of this "housing market news" has been ongoing for years, so today, I want to put them all to rest.
Is The Supply Of Homes For Sale Finally Rising?
Is The Supply Of Homes For Sale Finally Rising? Is the US housing market heading for a crash? Will home prices fall? Follow the metrics that clearly show what to expect from home prices and the supply of homes for sale in 2022 and beyond.
Who To Blame For Soaring Home Prices
There is a huge shortage of homes in the US, and there is only one culprit to blame, and I’m going to tell you who it is!
When Will Home Prices Fall?
Are Home Values About To Crash AGAIN? Now that we've seen about three years' worth of skyrocketing home prices, prudent buyers with memories are asking when home prices are going to start falling again.
Home Ownership Is Radically Different For Millennials
This is a simple millennial housing case study that will clearly show that the millennials will face a housing market like no other generation going back to post-World War II.
Are We Overbuilding Again?
I've been asked recently for my opinion on the number of homes being built in the US. Specifically, people are wondering if the ghost of 2006 has come back to bring more homes to the market than what can be consumed?
Home Affordability Crisis - Major Housing Market Shift
Home affordability is plummeting, and this home affordability forecast explains why real estate prices are becoming less affordable with each passing month.
Why It's Alway About Supply And Demand In Real Estate
It's all about supply and demand. The real estate supply and demand dynamic tells us everything we need to know to forecast home sales in any given area.
Building Permits Reveal Major Housing Crisis
How do we know there is a major housing crisis brewing? Look no further than building permits! This video examines building permits in detail, as the issue of home affordability is going to become one of the most prominent topics for many years in the national media.
Interesting Employment Dynamic Impacts Home Sales
Home sales in the United States are vibrant, and we can look to the economy as a big reason homes are selling. I have found a pocket of data on the Federal Reserve Economic Data website that explains the vitality of the US housing market.
How Often Do Home Prices Fall?
Are home prices falling? Will house prices fall soon? Home prices are soaring, buyers are having to pay above most sellers' asking prices, and the housing market feels just like a feeding frenzy during Shark Week on the Discovery Channel.
What Do Low Mortgage Interest Rates Really Mean?
Every article or video about mortgage interest rates conveys that rates are low, but do you really know what it means?
Homeownership Rate Crash #shorts
60 Second Video: Homeownership is going to decline over the next 30 years, as home affordability hits the worst levels seen since the end of World War II. This is a generational shift in the housing market

There are a lot of people who endorse Joe for the job of selling your home, from Barbara Corcoran (Star of ABC's Shark Tank) to Preston Scott (host of Tallahassee's top daily "Audio Magazine," as well as the thousands of happy customers Joe has helped in the past. Listen why!

Post a Comment

(850) 378-5727