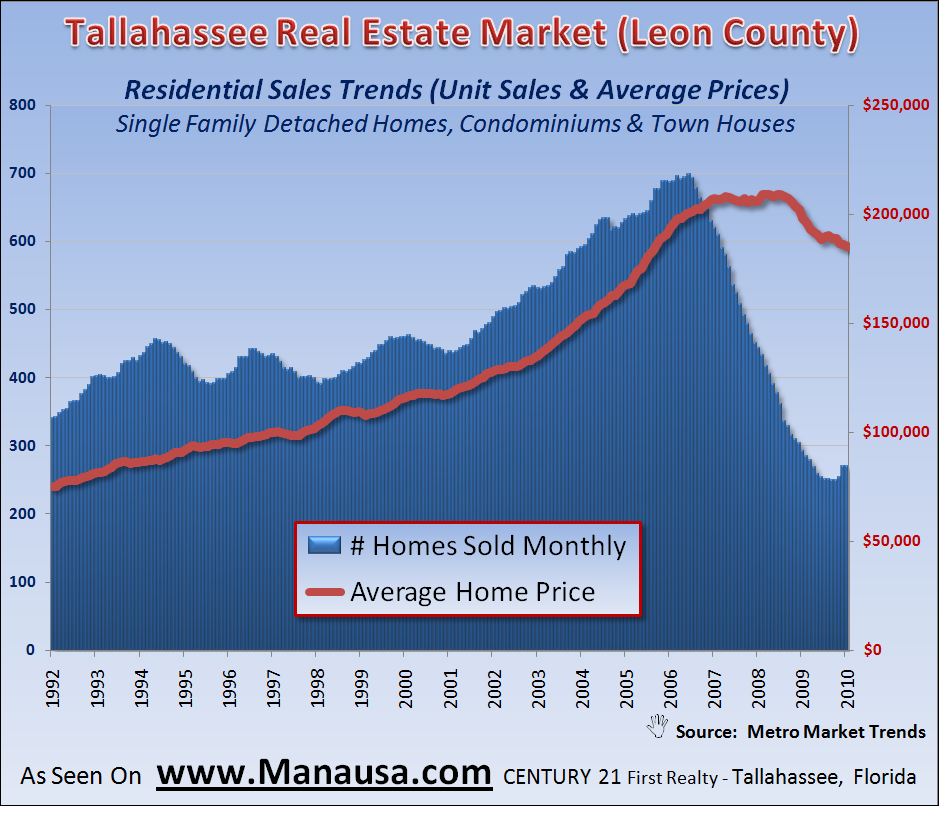
The Residential Sales Trends graph shows us historic home sales levels in Tallahassee. The blue vertical bars show the monthly unit sales trend, while the red line shows the average price trend. Our graph shows increasing unit sales and decreasing prices. We should see these trends continue until the market reaches equilibrium.