
 In 2024, the US housing market is an intricate tapestry of regional trends, each telling its own story. Understanding these trends is crucial, and the power of graphs in understanding the US housing market has become more relevant than ever. Everything you could want to know about current US housing market conditions can be found (and graphed) in the data available online.
As we see some regions like Albany and Grand Rapids gearing up for growth and others like coastal Florida potentially facing declines, what should we expect for the overall housing market?
Influenced by variable mortgage rates and housing supply challenges, this year’s market underscores the importance of visualizing and interpreting these complex dynamics through graphs and data. Stay ahead in the real estate game by grasping the power of this analytical tool.
US Home Price Trends
Home prices are expected to rise in most U.S. cities, but at a slower pace that aligns more with historical norms. This growth could vary significantly across different regions, with prices likely to fall in some areas (like parts of coastal Florida) and rise in others (like Albany, NY, and Grand Rapids, MI).
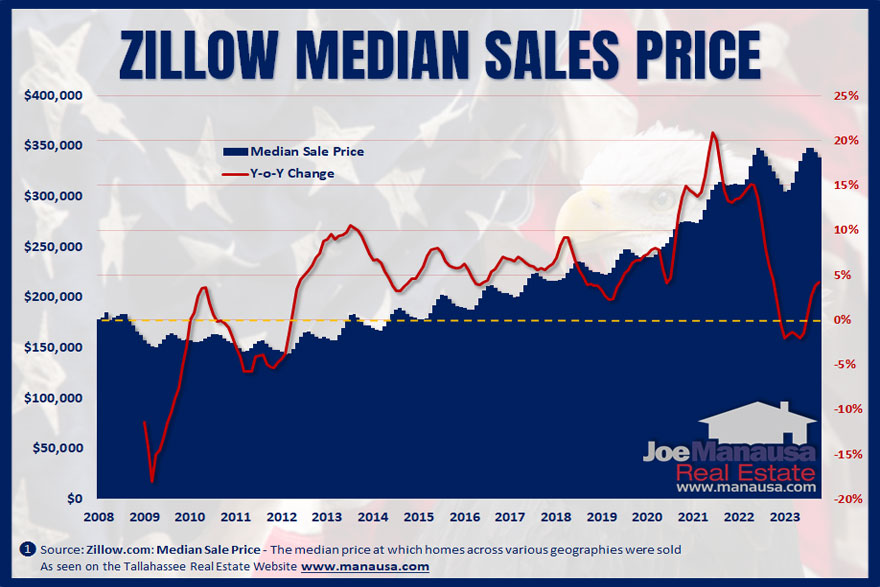
The overall trend suggests a rise in home prices by about 3 to 4%, though this growth may slow down later in the year due to factors like rising interest rates, an increase in home supply, and affordability challenges for buyers.
Impact of Mortgage Rates
Mortgage rates continue to play a crucial role in shaping the housing market. While there’s hope for a decrease in rates, their movement will be a key determinant of home pricing and sales dynamics.
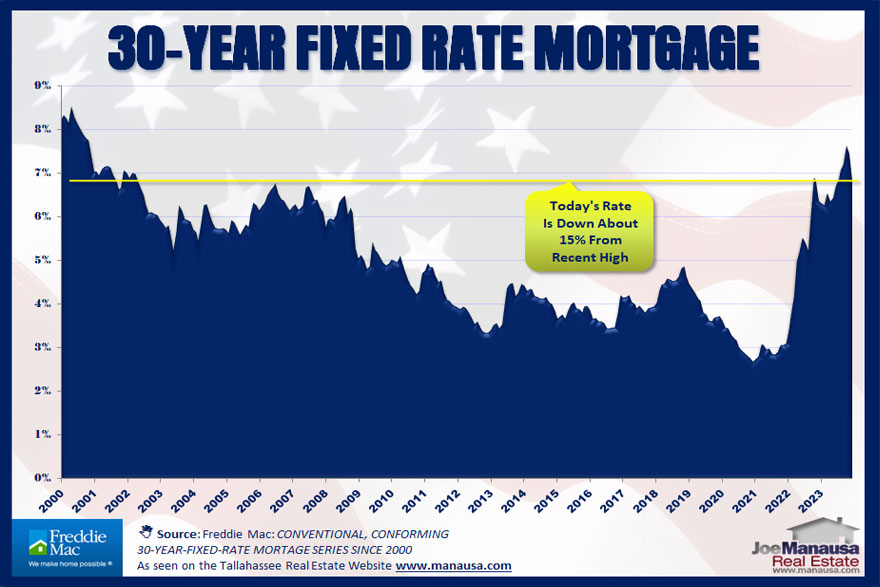
Should mortgage rates significantly drop, we could see a surge in buyer demand, potentially driving up home prices. Conversely, increasing rates may lead to reduced buyer demand.
However, contrary to a common belief that rising rates cause home price declines, due to the current housing supply-demand dynamics, increasing rates are more likely to slow the growth in home prices rather than cause them to fall. This is because when buyers withdraw from the market due to high mortgage rates, the primary source of new listings (homeowners selling to buy) diminishes. Therefore, a decrease in demand often leads to a parallel decrease in supply, maintaining a balance that prevents substantial price drops.
Housing Supply and Construction
The national housing shortage is expected to continue through the end of the 2020s. There has been a gradual increase in single-family housing starts throughout 2023, but it will likely take years of accelerated new home construction to significantly narrow the supply shortage gap.

The anticipated increase in new construction in 2024 is a positive development, but it’s unlikely to significantly alter the overall housing market dynamics within the year.
The prolonged shortfall in new home construction since 2008 has led to a housing shortage, exacerbated by a growing population. This scarcity has been a major factor behind the escalation in home prices and rents.
The upcoming uptick in construction might start addressing this issue, but given the depth of the shortage, it may take more time to see a substantial impact on the market.
Buyer and Seller Dynamics
The market in 2024 is predicted to favor sellers due to the ongoing national housing shortage. However, with potentially lower mortgage rates and a slight increase in housing inventory, buyers might find some relief compared to the previous years.

The interplay between buyers and sellers will indeed be a critical factor in shaping the 2024 housing market.
The graph above indicates a slight increase in the average monthly supply of homes for sale, moving above the 32-year low seen two years ago. However, the current actual supply of homes, at 1.13 million, is still 72% less than the peak during the housing bubble over 15 years ago.
This data underscores the resilience of home prices against significant drops, even with fluctuating demand. The current market conditions highlight a pressing need for more housing in the US. This is evident from the increasing homelessness rate, decreasing vacancies, and the escalation of both prices and rents to levels that are increasingly unaffordable for many.
The supply-demand dynamic illustrated by this graph is essential for understanding the US housing market’s current state and future trajectory. It’s a crucial indicator, a “power graph,” providing insights into market stability and potential future trends.
Regional Variations and External Factors
The housing market’s performance will vary significantly across regions, influenced by local economic conditions, climate risks, and housing policies. External factors such as economic unpredictability, financial market volatility, and geopolitical situations could also influence market dynamics.

While Zillow predicts that fewer than half of all US markets will see rising home prices, the persistent imbalance between supply and demand will likely continue driving overall growth in US home prices. This imbalance, marked by a limited supply against a backdrop of a growing population, can exert significant upward pressure on prices.
I recommend closely monitoring your specific market’s local supply and demand dynamics. These local factors are crucial in determining the direction of home prices. Housing markets can vary widely from region to region, and understanding these nuances will provide better insights into potential price movements in your area. Keeping an eye on local trends, inventory levels, buyer demand, and economic factors will be key to making informed decisions in the housing market.








Housing Crash or Boom? Here’s What’s Coming in 2025