 The March Pending Home Sales Report is a leading indicator of home sales, meaning it provides an earlier insight into housing market activity than we get by studying lagging indicators, such as home sales.
With the exception of detailed supply and demand numbers, there is no better source of current information than one can glean from new contract activity in the housing market.
Today’s report is a comprehensive review of new contracts and it concludes with a revealing forecast of the coming months in the Tallahassee real estate market.
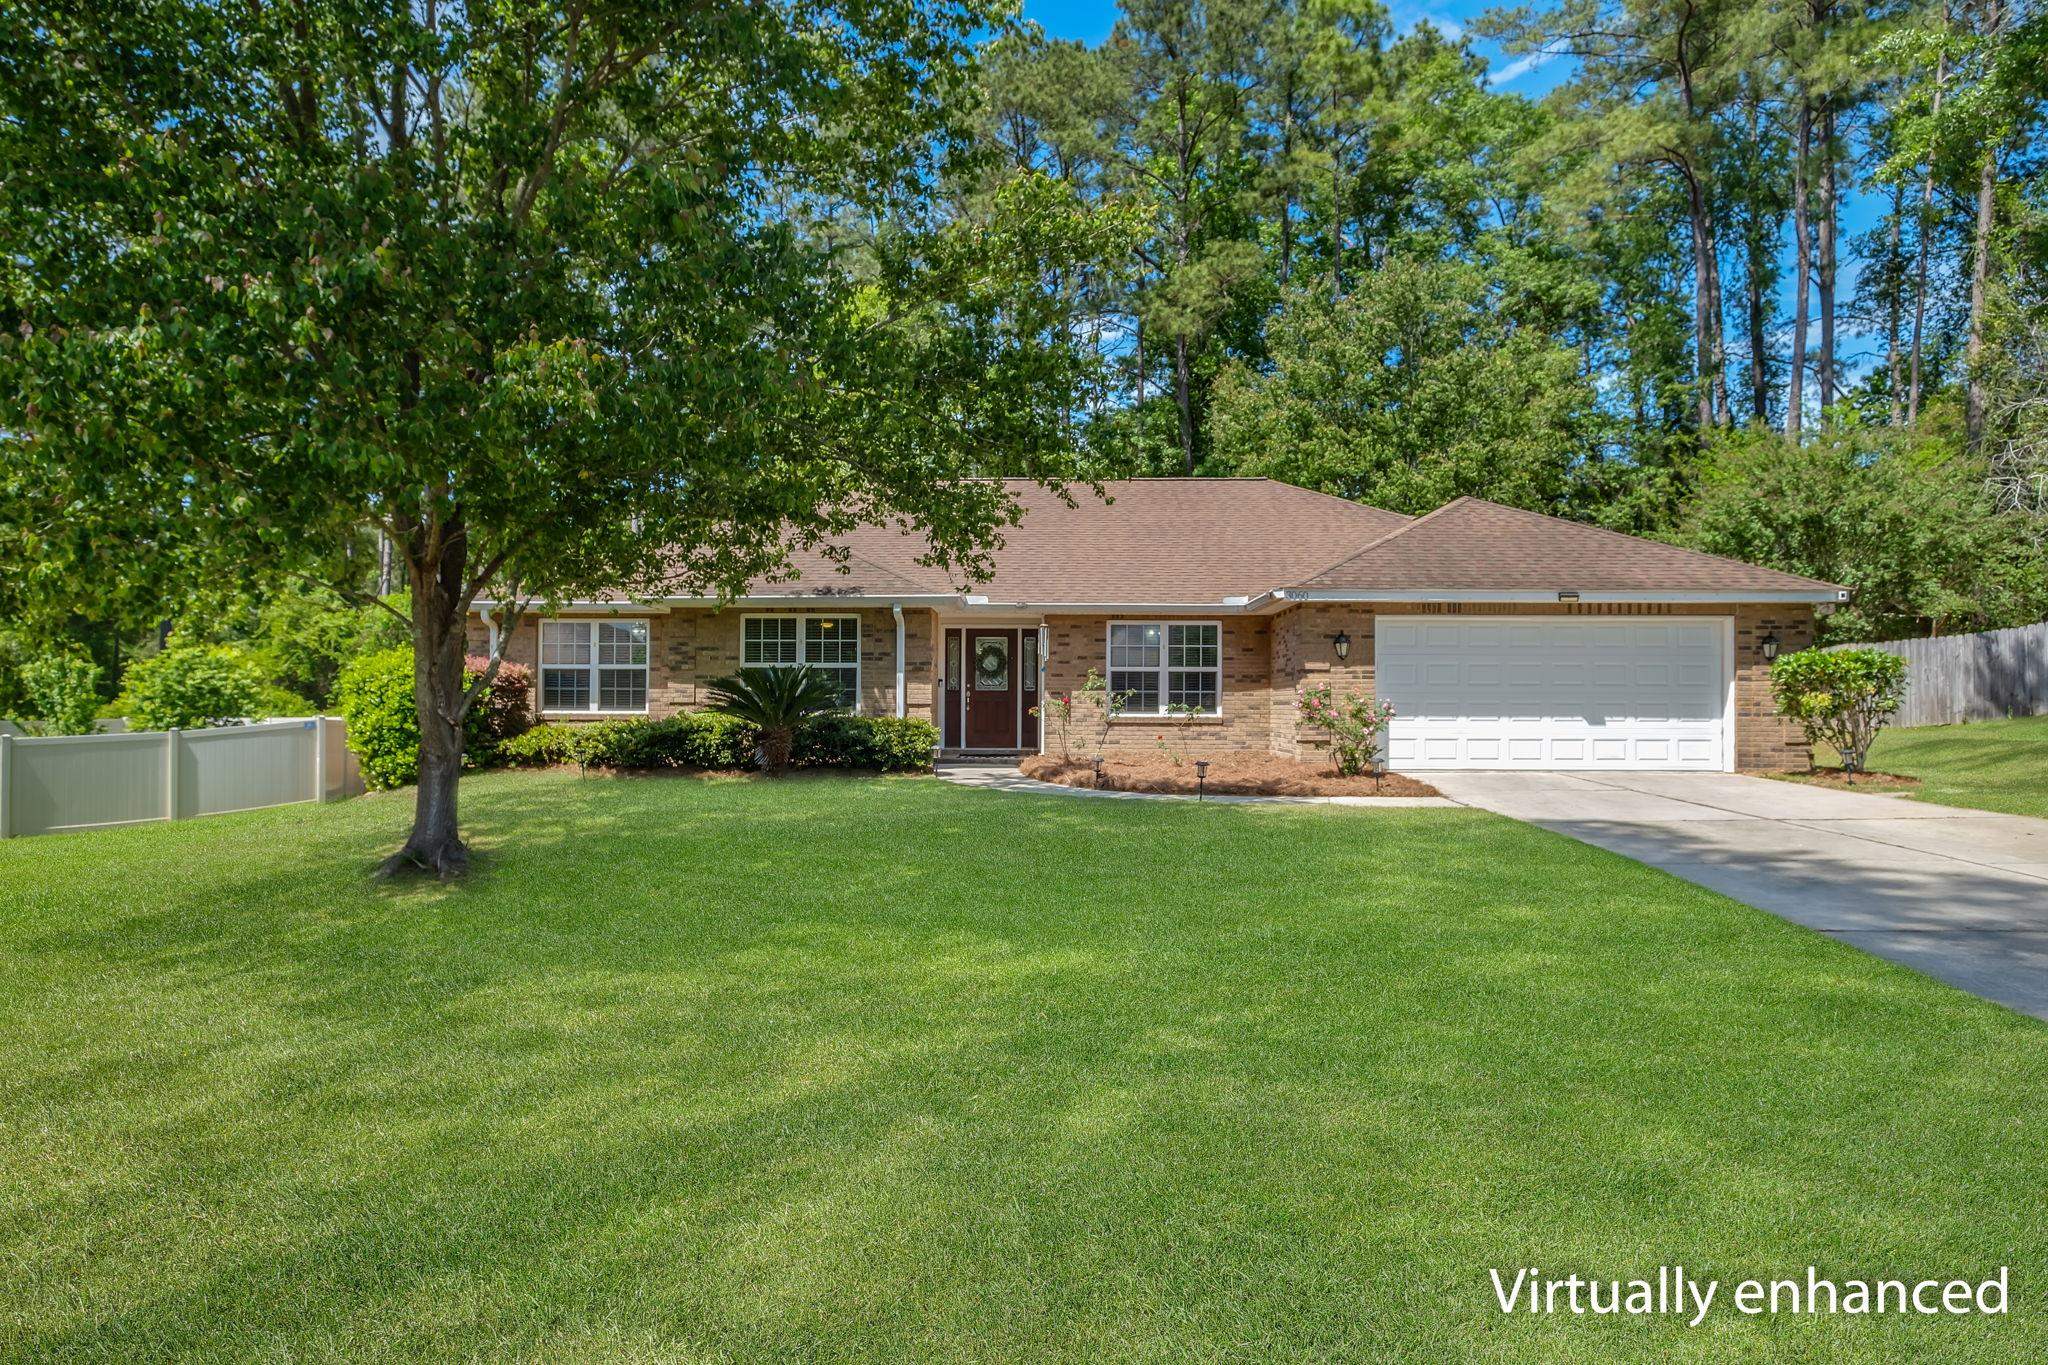
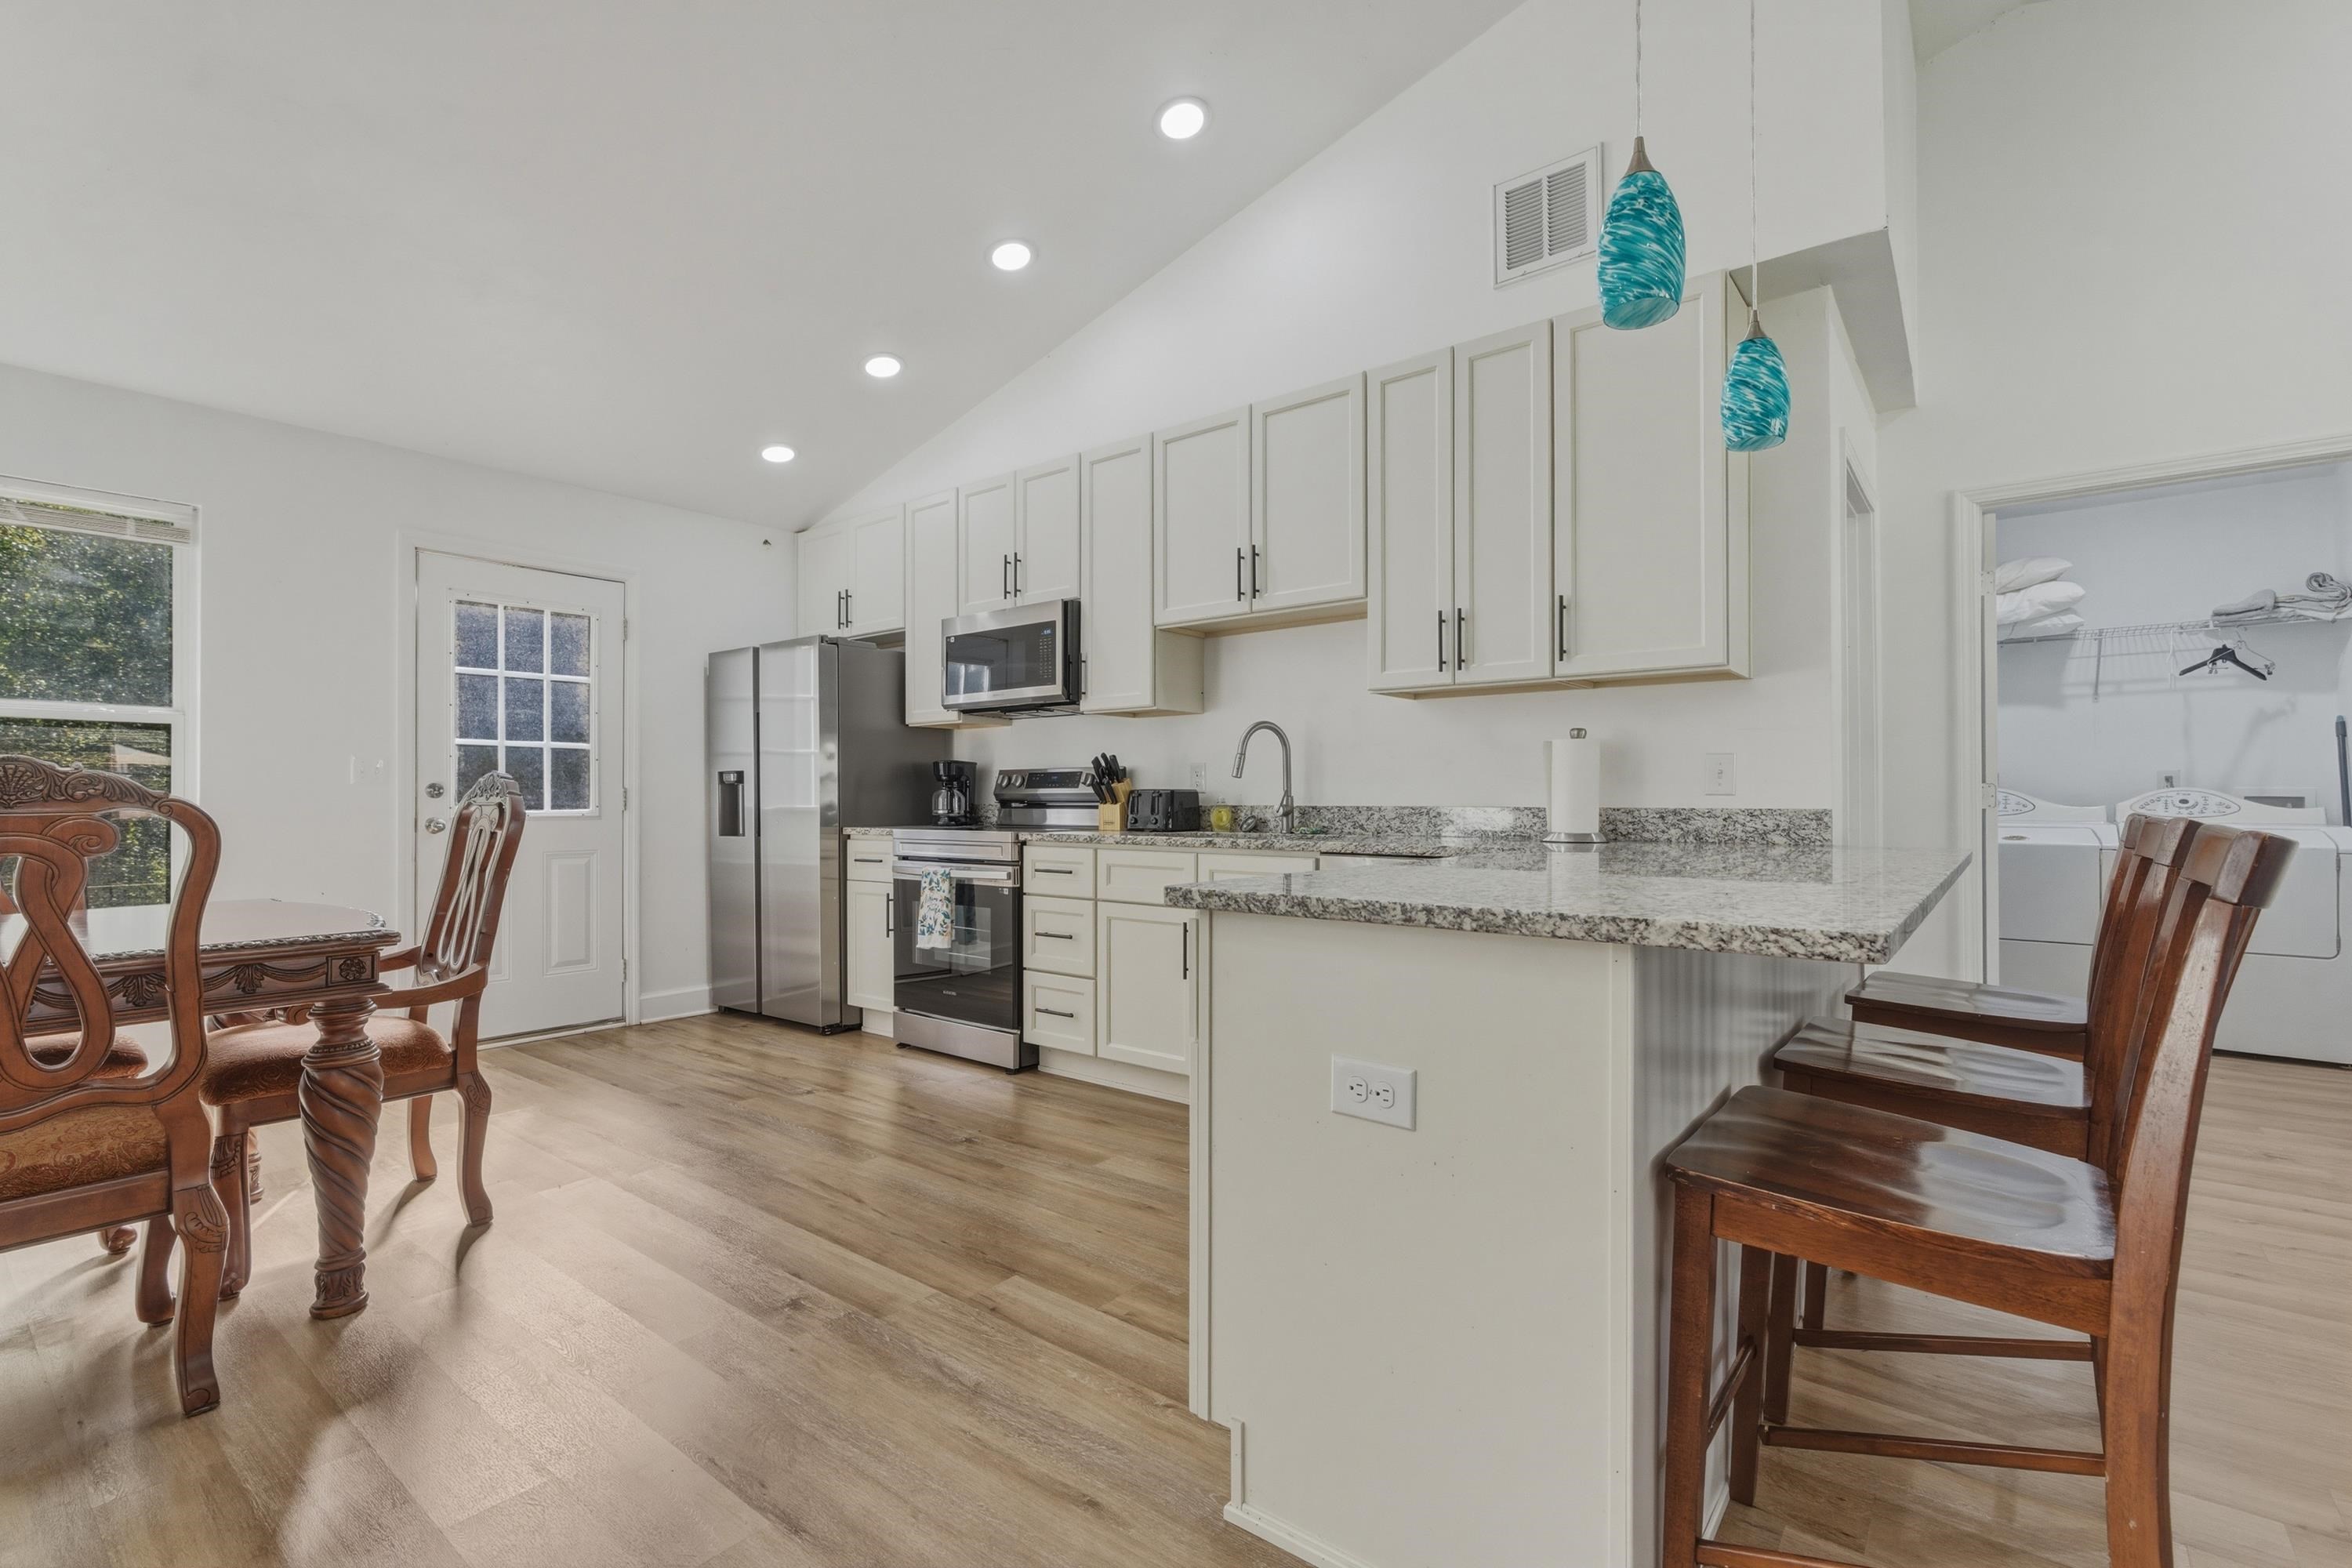
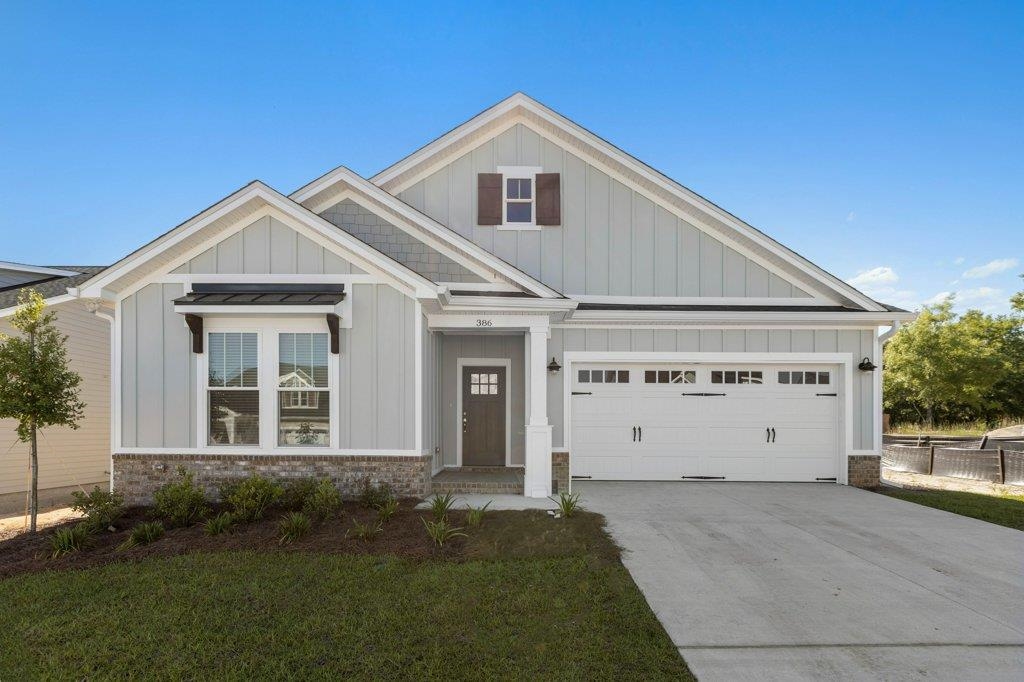
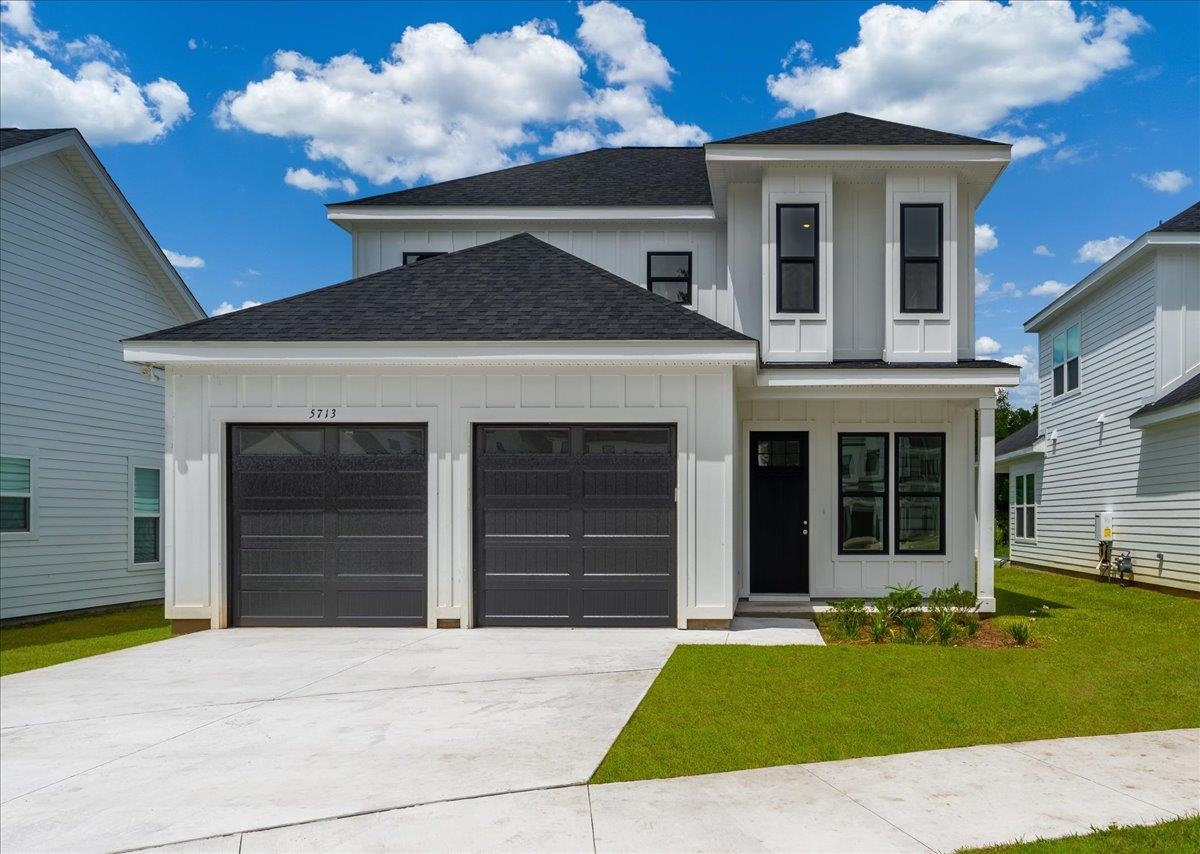
First, check out the homes for sale in Tallahassee and notice how many of them are already “contract pending” (once you scroll past the luxury homes).
Homes For Sale In Tallahassee
Tallahassee Homes for Sale


Video Presentation Of The Pending Home Sales Report
Active Housing Market Growth
Our first graph plots each month’s sales, organized by the date the contracts were written.

The number of homes that were put under contract each month are color-coded, with the blue bars showing 2019, the gray bars showing 2020, and the red bars showing 2021 contracts.
Contracts were up in January and February, and the number of contracts written through the 23rd of March is just 11% fewer than those written through all of March of last year, and we still have the final quarter of March to go!
It’s important to point out that not all of these new contracts will close, so it will take some time to get an accurate evaluation of the market today versus the market at this time in previous years.
Demand For New Homes Grows
Through all of our inventory reports over the past few years, I have pointed out that we need more homes. We need existing sellers to put their homes on the market, but more importantly, we need builders to deliver additional homes to compensate for the lack of new construction over the past 6 years.
While we did see builders increase production in 2020, we have seen this trend reverse and March appears to be the worst of the previous 15 months for builder activity.

The blue bars measure existing home contracts, both pending and closed, by the date the contracts were written while the red measures the same for new home construction.
The red triangles report the percentage of contracts written each month that was new construction, and right now March is below 6%. We need to see new construction push closer to 20% for at lease a year or two. The red line shows the one-year trend of the new construction share of the market, and I am greatly concerned about its decline.
Last year, just over 12% of the contracts written were for new homes, but the trend for new home share has been dropping for three months in a row. As of right now, 106 new construction homes have gone under contract in 2021 versus the 119 that were written through all of March in 2020, an 11% shortfall though we still have just over a week left to close the gap in 2021.
In the 1990s, it was not uncommon for 20% of all home sales to be new construction, and back then we did not have an inventory shortage like we do today. Builders today could double production without the risk of creating an oversupply in the market, so long as they pay attention to the areas and price ranges in which they build.
Consider this a plea to all local homebuilders, we need more houses! If you want to know why that I believe builders are not building today, you should check out my most recent video on the US housing market below.
US Housing Market UPDATE
Contract Prices Move Higher
In this next graph, I calculated the average price of homes under contract in 2021 each month and compared it with the same months in 2020. Look what’s happening in March!

Buyers in March have been spending 9.5% more than previous buyers were spending in March 2020.
We have to remember that this is an interest-rate-fueled buying frenzy, and it will slow considerably when interest rates rise. The high-end could go nearly dormant if interest rates rise substantially, and that would slow the average home price growth considerably. But it will not stop prices from moving higher!
Remember, supply and demand determine price movement, and the lack of inventory means that we should expect prices to continue higher, even if demand is cut significantly. Builders cannot produce new inventory (which is needed) until existing home sale prices catch up to escalating new home costs.
Recent Videos From Joe


Real Estate Appreciation Remains Too High
Similar to the previous graph which tracked home prices, this graph tracks the average home value in 2021 each month and compares it with the same months in 2020. Prices are what buyers are spending, whereas values are what sellers are getting and is used to measure appreciation in the housing market.

The graph shows that the appreciation rate each month in early 2021 is averaging just over 8%.
Overall, last year’s appreciation rate was close to 9.4%, which is about three times the average we’ve seen over the past thirty years. With inventory remaining at historic lows, I’m expecting to see appreciation move even higher.
As reported in numerous other market updates, we continue to see low inventory levels in most areas and price ranges below $600K, and this is the biggest contributor to the accelerated appreciation rate.
Now is a great time to sell a home, as buyers want to take advantage of historic low mortgage interest rates before they go away.
Contract Activity Over Time
This graph identifies when the current pending and closed contracts were written, with closed contracts shown in blue and pending contracts shown in red. We do this to identify the highest buyer-activity periods and to evaluate the health of the pipeline.

By pipeline, I mean the pending home sales and how they are distributed. Since the typical contract closes in 30 to 45 days, we have to be concerned with the number of contracts that appear in our report that are older than 45 days. Currently, about 35% of contracts are older than 45 days, which is better than what we measured the last time we published a Pending Home Sales Report. Currently, less than 1 in 4 pending contracts in our MLS was written before this year.
Right now, the oldest pending home sale goes back to August of 2018, which is likely an MLS maintenance issue that needs to be removed. There are an additional 9 pending contracts that are more than a year old and are likely bogus as well.
Currently, there are 716 Tallahassee homes for sale in the MLS that are under contract with buyers (pending contracts). This represents a growth of nearly 12% since our last Pending Home Sales Report.
This is a normal seasonal move from what we historically see as the market blooms from the Winter in February to the Spring in March. What is not normal is the percentage of homes listed that are already under contract with buyers. Specifically, the number of contracts compared to the overall pool of listings is far higher than we would seasonably experience, so sales are good but inventories are far too low.
It’s important to understand what this means. Yes, demand has grown about 12% from last month, at a time of year where we expect to see demand grow. The limited inventory of homes for sale means that relative demand (demand relative to the current supply of homes) is exploding.
Buyers are wanting to take advantage of low mortgage interest rates, so now is the best time to sell a home that I have seen in my 30 years selling homes in Tallahassee.
How February Compared To Last February
The year-over-year home sales graph below has been set up in a different fashion than all previous graphs in this report.
Note that this one shows all homes sold segmented by the date of closing, while the past graphs were assembled based upon contract dates. I include this in the pending home sales report as a bridge to our other market reports and videos that focus on closed sales dates.

Six of the past seven months have posted gains over the same months in the year prior. In February, the market was up 8% over last February, and that was a strong February as well. It’s too early to call March, but I suspect we’ll have our seventh straight months of gains.
")
So how strong were the first two months of 2021? The graph above shows that it was the third-best start of the year on record, falling behind only 2005 and 2006 when inorganic demand pushed the market to unsustainable highs.
So should we be worried about the sustainability of the current market?
In short, yes and no. Yes, we need to be concerned about how the market will cool when mortgage interest rates rise, but no, the number of sales occurring right now is very much an acceptable level when you consider the population growth in Tallahassee since the market peaked 15 years ago. Additionally, you can view a comprehensive examination of the state of the US housing market on our Youtube Channel.
As an over-simplification, we are bigger now so we should expect more buyers in the market. Additionally, we are not seeing the signs of a housing bubble like we did in 2005, where inventory levels started to rise. Today, inventory levels are falling, a sign that more homes are needed.
Homeowners who have been considering a move need to take note. Current conditions are the best I’ve ever seen for getting top dollar for your home while also selling it within a predictable time schedule.
I am confident that the seller’s market conditions will continue for the foreseeable future, but I do believe rising mortgage interest rates will eventually reduce the advantage that current home sellers enjoy.
Anybody who studies interest rate history will tell you that mortgage interest rates are going to rise. Nobody knows when, but certainly, rates will not stay this low forever. When mortgage interest rates do rise, demand at the top of the market will erode significantly and decline throughout the lower price ranges.
If you know you want to move, you should strongly consider doing so immediately while both inventories and mortgage interest rates are each working to your advantage.
Regardless of what you decide, we’ll be here to keep you up to date on the pending home sales in the Tallahassee real estate market.
When moving to, in, or from Tallahassee, you will fare better if you work with a local expert. We are here to help. If you have further questions on the Tallahassee real estate market, you can leave a comment below, give us a call at (850) 366-8917, or drop us a note and we'll give you the local information needed to ensure a successful, smooth transaction.
As a local born and raised in Tallahassee with a focus on customer service, I promise you'll find great success when working with Joe Manausa Real Estate, just as have our past customers. You can read thousands of their reviews reported on Google, Facebook and Zillow right here: Real Estate Agent Reviews Tallahassee.
 Have you heard about my new book "The Business of Getting Business?" It's a comprehensive guide for small businesses to help them make the move to digital. For those of us who want to survive and thrive in a world where large corporations are taking over, it is a must-read. It's also the perfect guide for how to sell a home in the digital age. You can find The Business Of Getting Business by clicking on any of the trusted retailers below.

Think all REALTORS are alike?
Read what people are saying about working with Joe Manausa Real Estate! You can see thousands of real customer reviews reported on Google, Facebook and Zillow at this link: CLICK HERE FOR REAL ESTATE AGENT REVIEWS.
