The US has reached a new record for the number of homes under construction.
About 20% more homes are being built today than when the housing bubble was forming back in 2006, and there is no sign that the new construction pipeline will reverse any time soon.
Perhaps the most significant housing market fears being hyped on social media concern the flood of new homes that will hit the market when construction is completed. These reports declare that inventories will be soaring while home prices crash. I’ve seen numerous reports calling for as much as a 50% price correction due to the decline in demand and rise in inventory.
Rather than take these unsupported prophecies as fact, why not follow the data and see where it leads us?
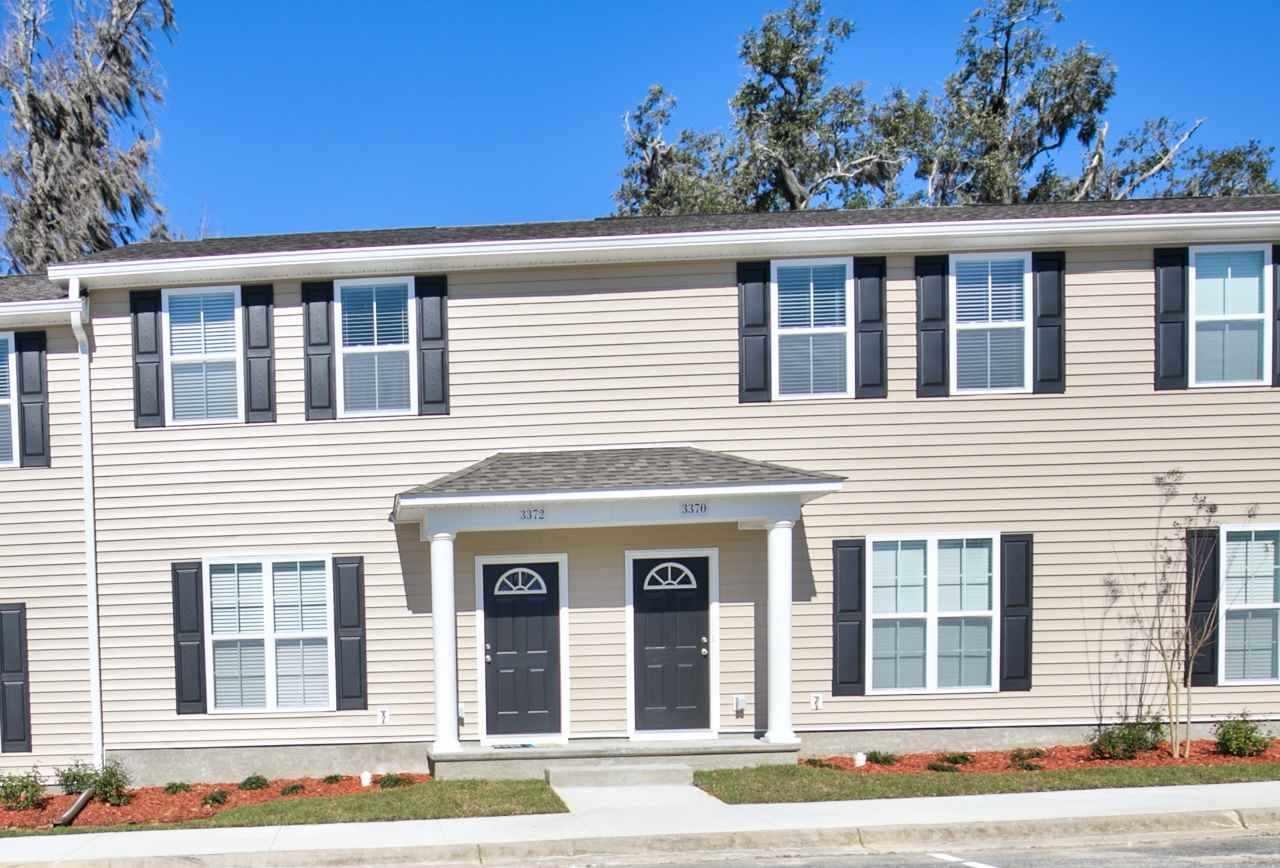
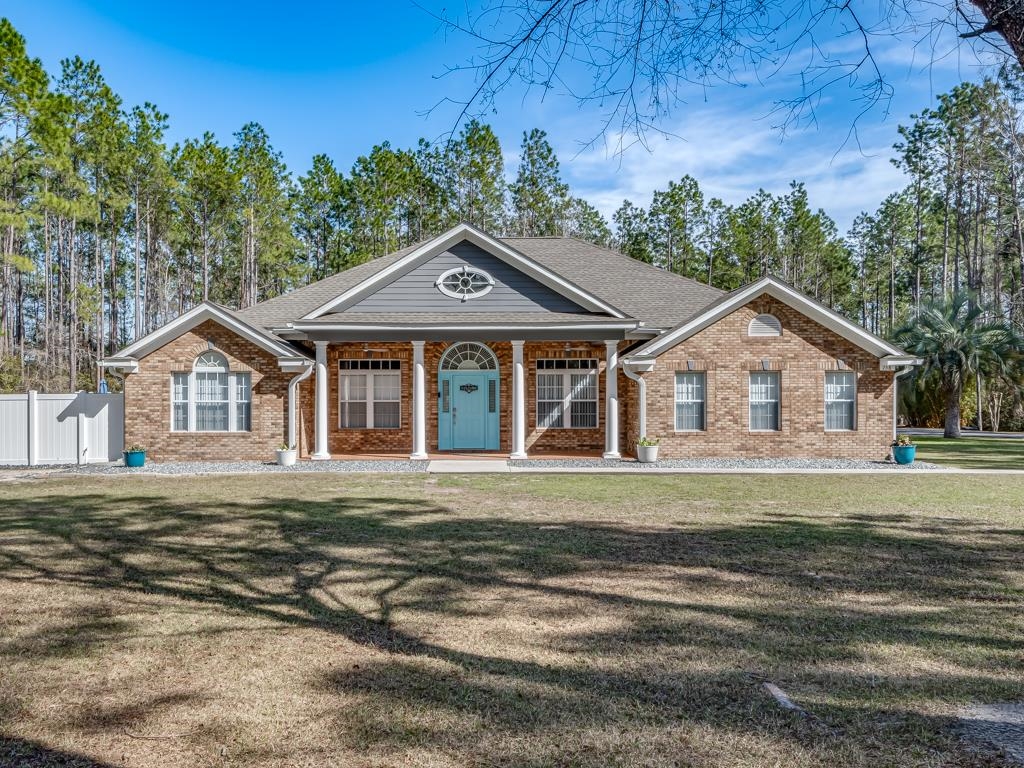
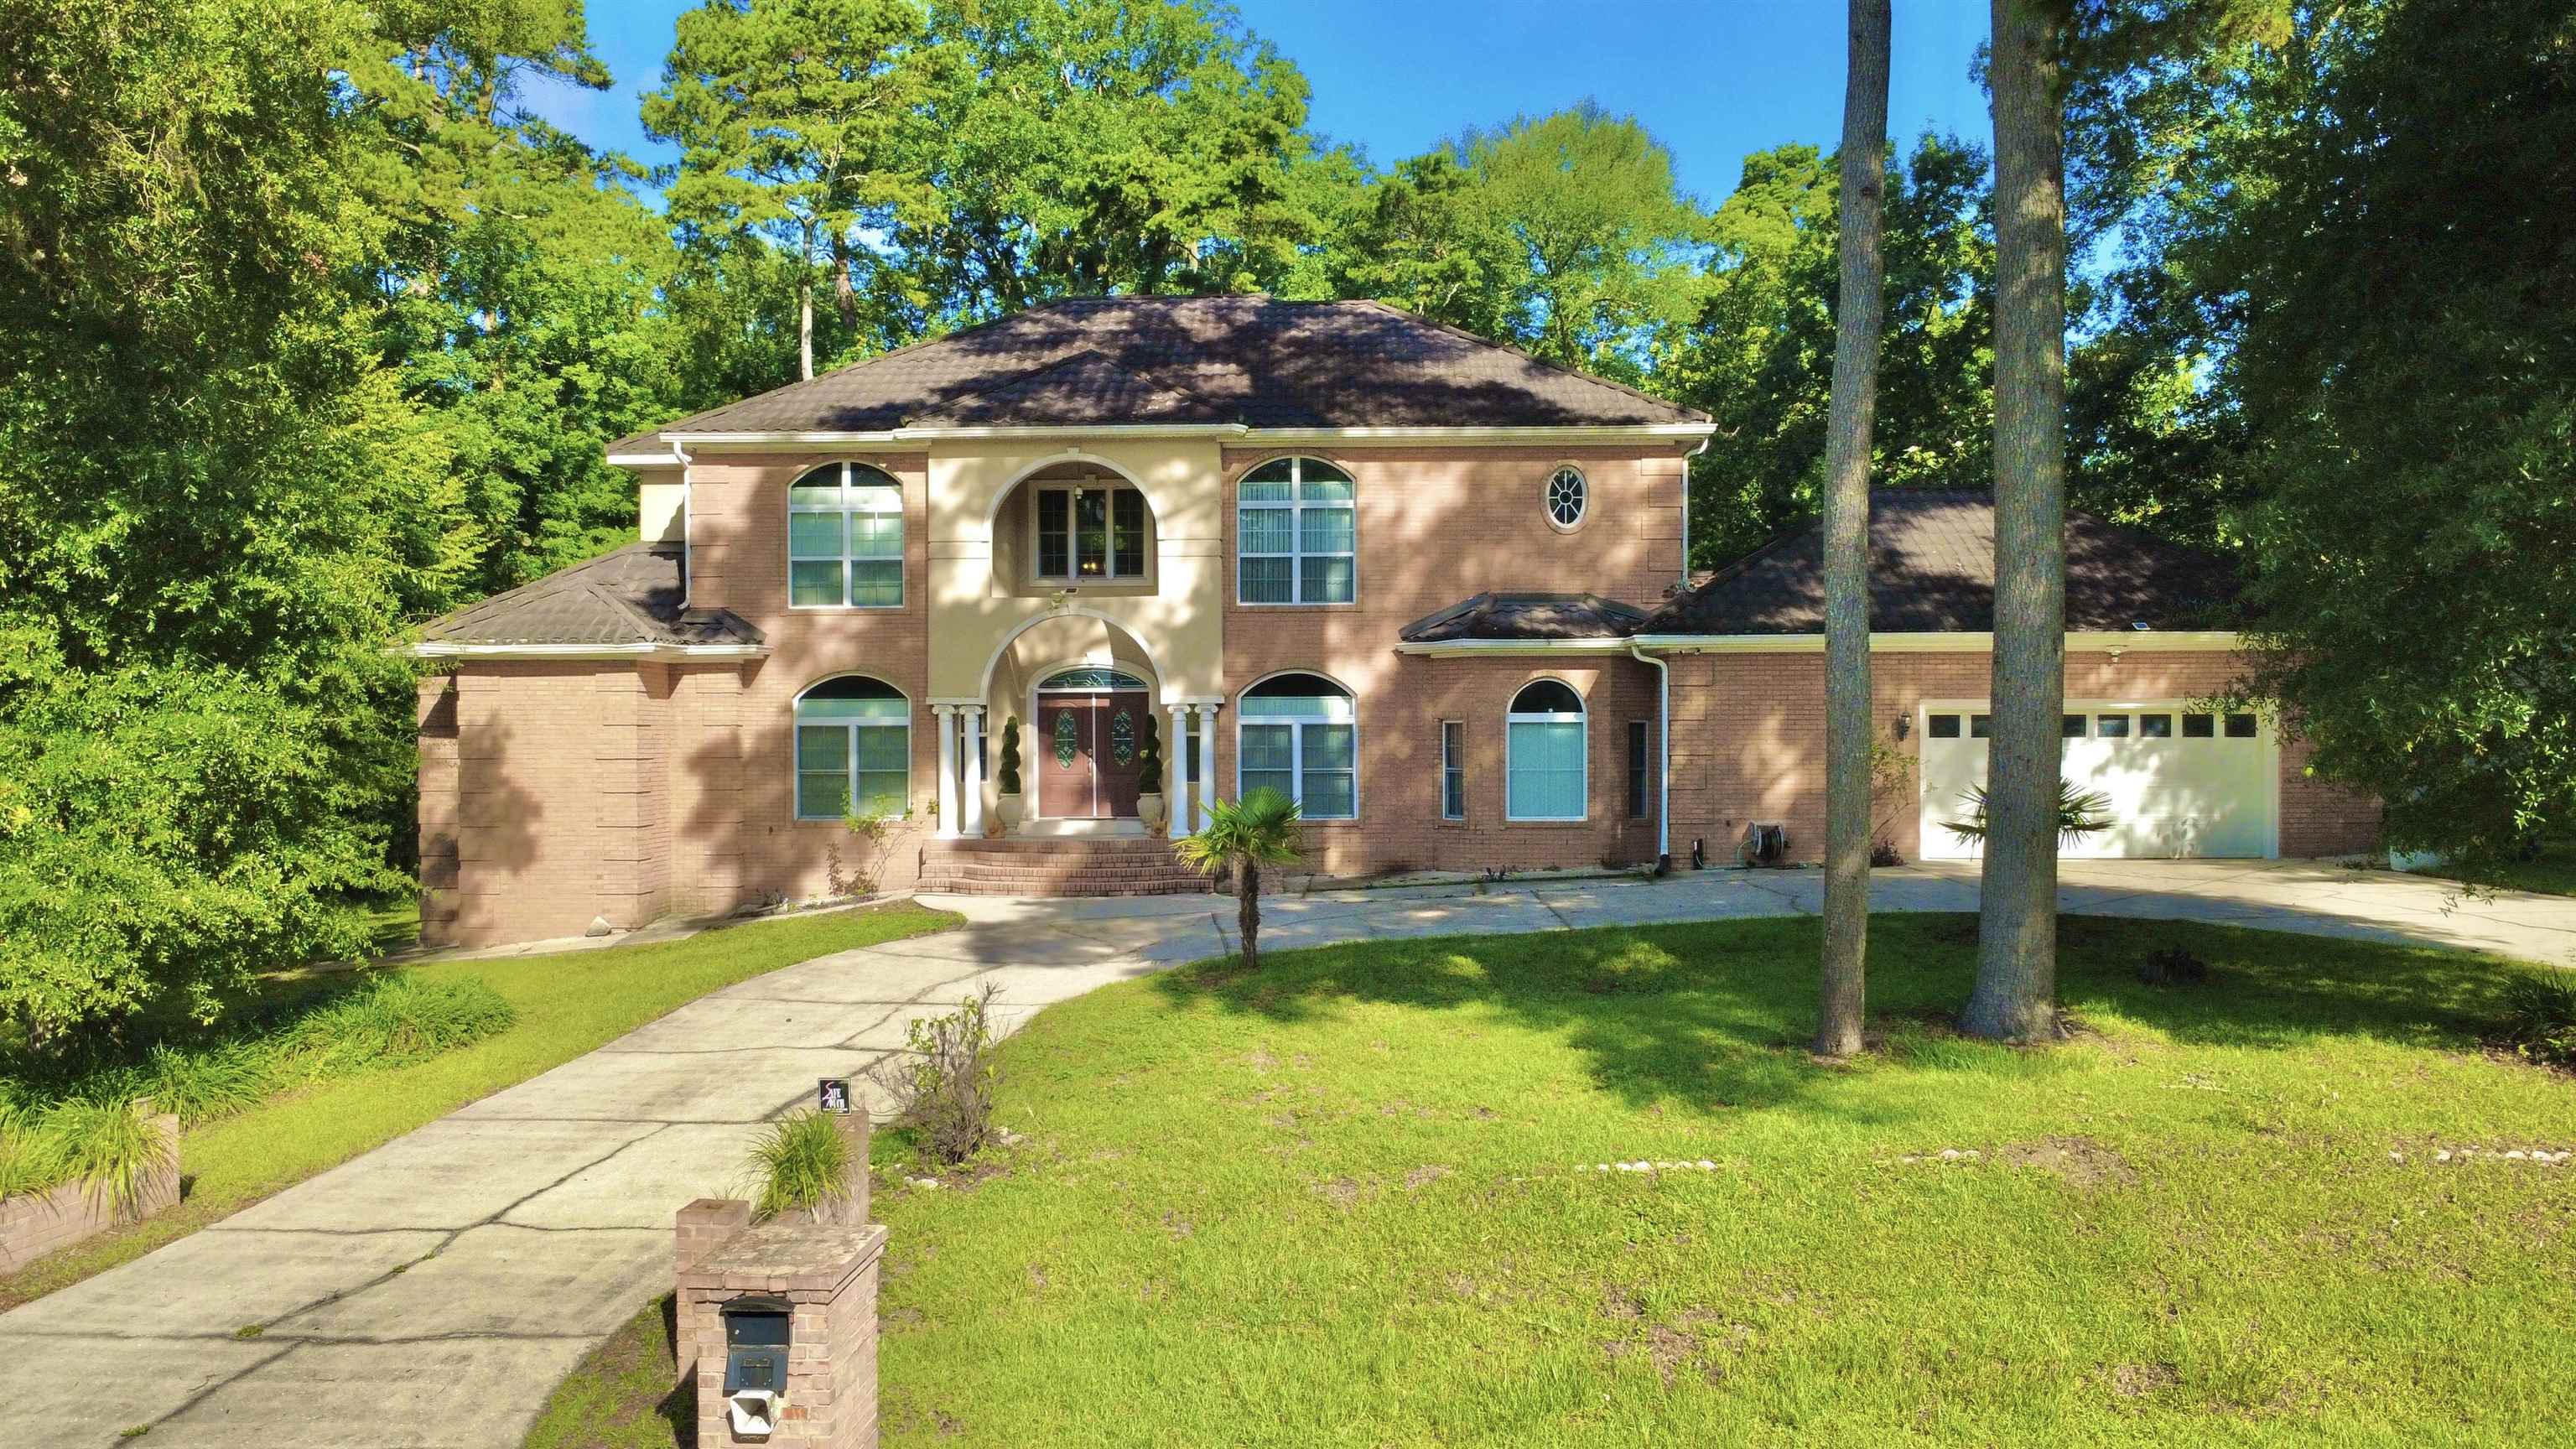
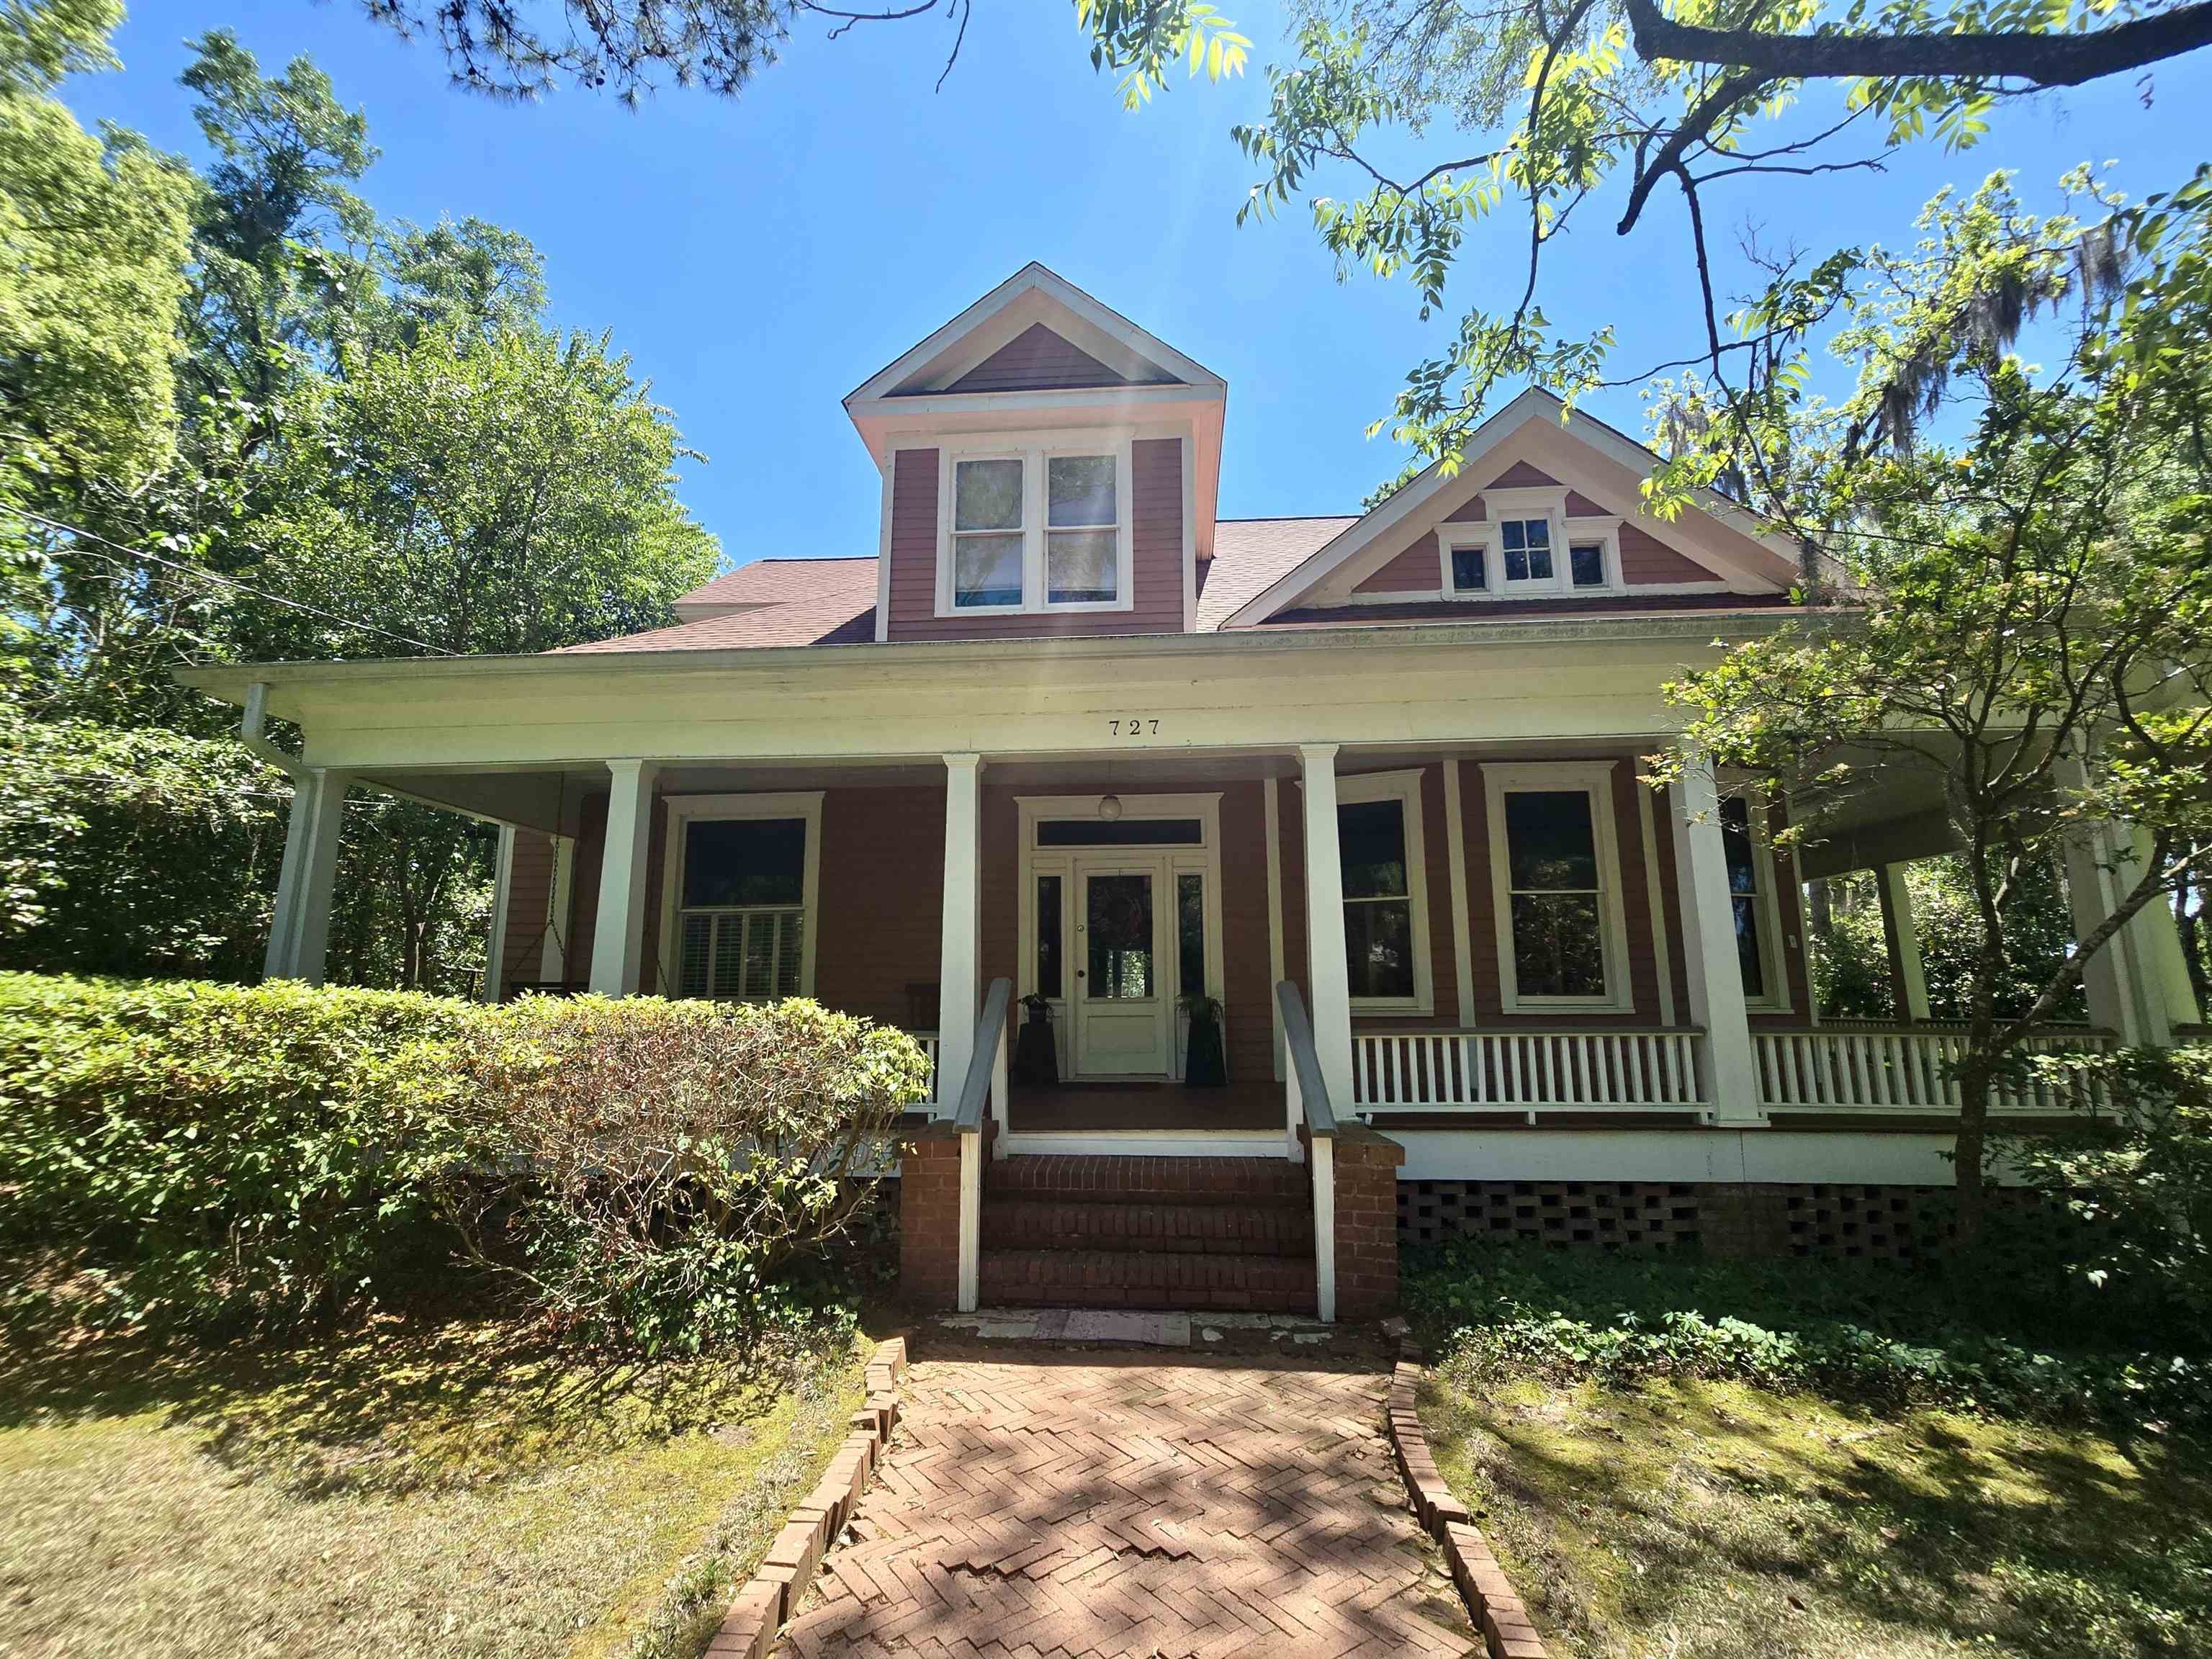
Before we get to the analysis, I have included a list of all new construction homes in Florida’s Big Bend so that our readers can see what’s available today (including this incredible find on Florida’s Forgotten Coast).
New Construction Homes For Sale In Florida’s Big Bend
New Home Construction In The Florida Panhandle


Housing Crash or Boom? Here’s What’s Coming in 2025

BIGGEST Housing Market Myth EXPOSED by New Foreclosure Data
Homes Under Construction In The US
When you go onto YouTube and see video titles calling for a 50% price correction in housing, it is often “supported” by the following information about the current number of new privately-owned housing units under construction.

This graph clearly shows that the pipeline is at an all-time high (20% higher than in January 2006), and the trend is still moving higher. Many people are concerned about what will happen when all these homes hit the market.
There are two hugely important factors when considering the abundant pipeline revealed in this graph. First, the pipeline is larger because it is taking longer to build homes today due to supply chain disruptions, and second, most homes are selling before or as they are completed.
We will know an over-supply problem is mounting when the months of supply of completed homes begin to rise rapidly.
Current Supply Of New Construction Homes
This graph plots the median months of supply of new construction homes in the US.

The number of finished “ready to buy and occupy” new construction homes is near an all-time low at fewer than two months of supply. This is diametrically different from a growing inventory of homes.
As I explained in a previous report (which you see around the 7:20 – 8:00 mark in the video below), the current pipeline of new homes being built is taking nearly 50% longer to shed new homes; thus, the pipeline can be 50% larger without it producing homes at a faster rate.
Scale & Relativity Required In Record-Setting Years
The following graph was inspired by a recent post by Erdmann, who warned that any “record number” has to be scaled with the size of the country over time. So, for example, a half-million more units in our country today, with 142 million existing units, is a lot different than a half-million more units in our country fifty years ago, with 76 million units.

In the graph above, we have plotted the new construction pipeline relative to the US population over the years. The blue line plots the vacant units for rent (compared to the population size). For example, at the far left of the graph, there were roughly 11 vacant for-rent housing units for every 1,000 people in the US, whereas today, we have just a little more than eight vacant for-rent housing units for every 1,000 people in the US.
The red line reveals that there were just under four vacant for-sale housing units for every 1,000 people in 2000, whereas there are about half as many today. When we examine both the blue and red lines together, we see that vacancies today are lower than at any time in the past 22 years. Homes today are being used at the highest rate on record, a sign that we have too few homes available for our growing population.
Finally, the gray line shows that about five housing units are under construction for every 1,000 people today (slightly higher than the peak in 2006). This could be a cause for concern, but the fact that homes are taking longer to build more than compensates for the difference in the totals of then versus now.
Erdmann advises:
The decline in vacancies since the Great Recession has been unprecedented. From 14 rental units per thousand residents to 8, and from 8 units for sale to 2. Back to 2000, the previous lows had been about 10 and 4. There are about 2 1/2 units per thousand residents under construction in both the apartments and single-family categories. In other words, if every single unit under construction was finished tomorrow and sold (all else equal), vacancies would rise back to where they were in about 2017 and 2000. Those were both periods with constrained supply, as evidenced by (the next graph), which shows shelter inflation (mostly rent) relative to non-shelter core inflation. Rent inflation should not be persistently more than general inflation.
Get Our Free Market Update

Other buyers, sellers, lenders, and real estate agents have this critical information, and now you can too!
Get immediate access to our most recent newsletter.
Let more than 30 years of experience work for you with charts, graphs, and analysis of the Tallahassee housing market.
Each Monday morning we send out a simple, one-page report that provides a snapshot of the Tallahassee housing market. It only takes 2 minutes to read, but it gives you better market intelligence than most real estate agents possess. Just tell us where to send it below!
Home Affordability Is Tanking Fast
Long-time readers of the Tallahassee real estate blog know that we have been warning about a home affordability crisis for several years, long before mortgage interest rates and home prices rose to current levels. This graph shows the problem has been brewing far longer.

In the graph above, the red line plots shelter inflation (mainly “rents), while the blue line plots the non-shelter core inflation. The gray line reveals the difference between the two measurements.
At the far left of the graph, shelter inflation trailed non-shelter core inflation by nearly 18% from 1957 through the late 1960s. This means that rents were rising at rates slower than most goods and services.
At the far right of the graph, we now see rents growing far faster than most goods and services. A simple conclusion from this graph is that compared to other goods and services, the cost of renting a home has been rising fast.
I have highlighted three points on the graph:
A. Something occurred in the late 1960s that caused rents to accelerate in growth more so than other goods and services.
B. In the mid-1980s, we saw shelter inflation draw even with non-shelter core inflation and then finally pass it. In other words, this is when the home affordability crisis began to develop!
C. Something occurred in the mid-1990s that caused shelter inflation to accelerate far faster than non-shetler core inflation.
I suspect some of our readers will have ideas about what happened at points A, B, and C. If you think you know, share your thoughts in the comments below.


Fannie Mae Report: It's The TRUTH About The Housing Market

Real Estate Meltdown: Starter Homes at $1M in 233 Cities

Is the Housing Market Crashing? | Redfin April 2025 Update

Is This The CALM Before The CRASH? Volatility Rocks Housing