 The median home price is soaring higher in today’s inventory-starved market, so let’s take an in-depth review of what’s going on with the median home in Tallahassee.
In today’s report, we’ll look at the median home price, median home value, and median home size in two separate ways.
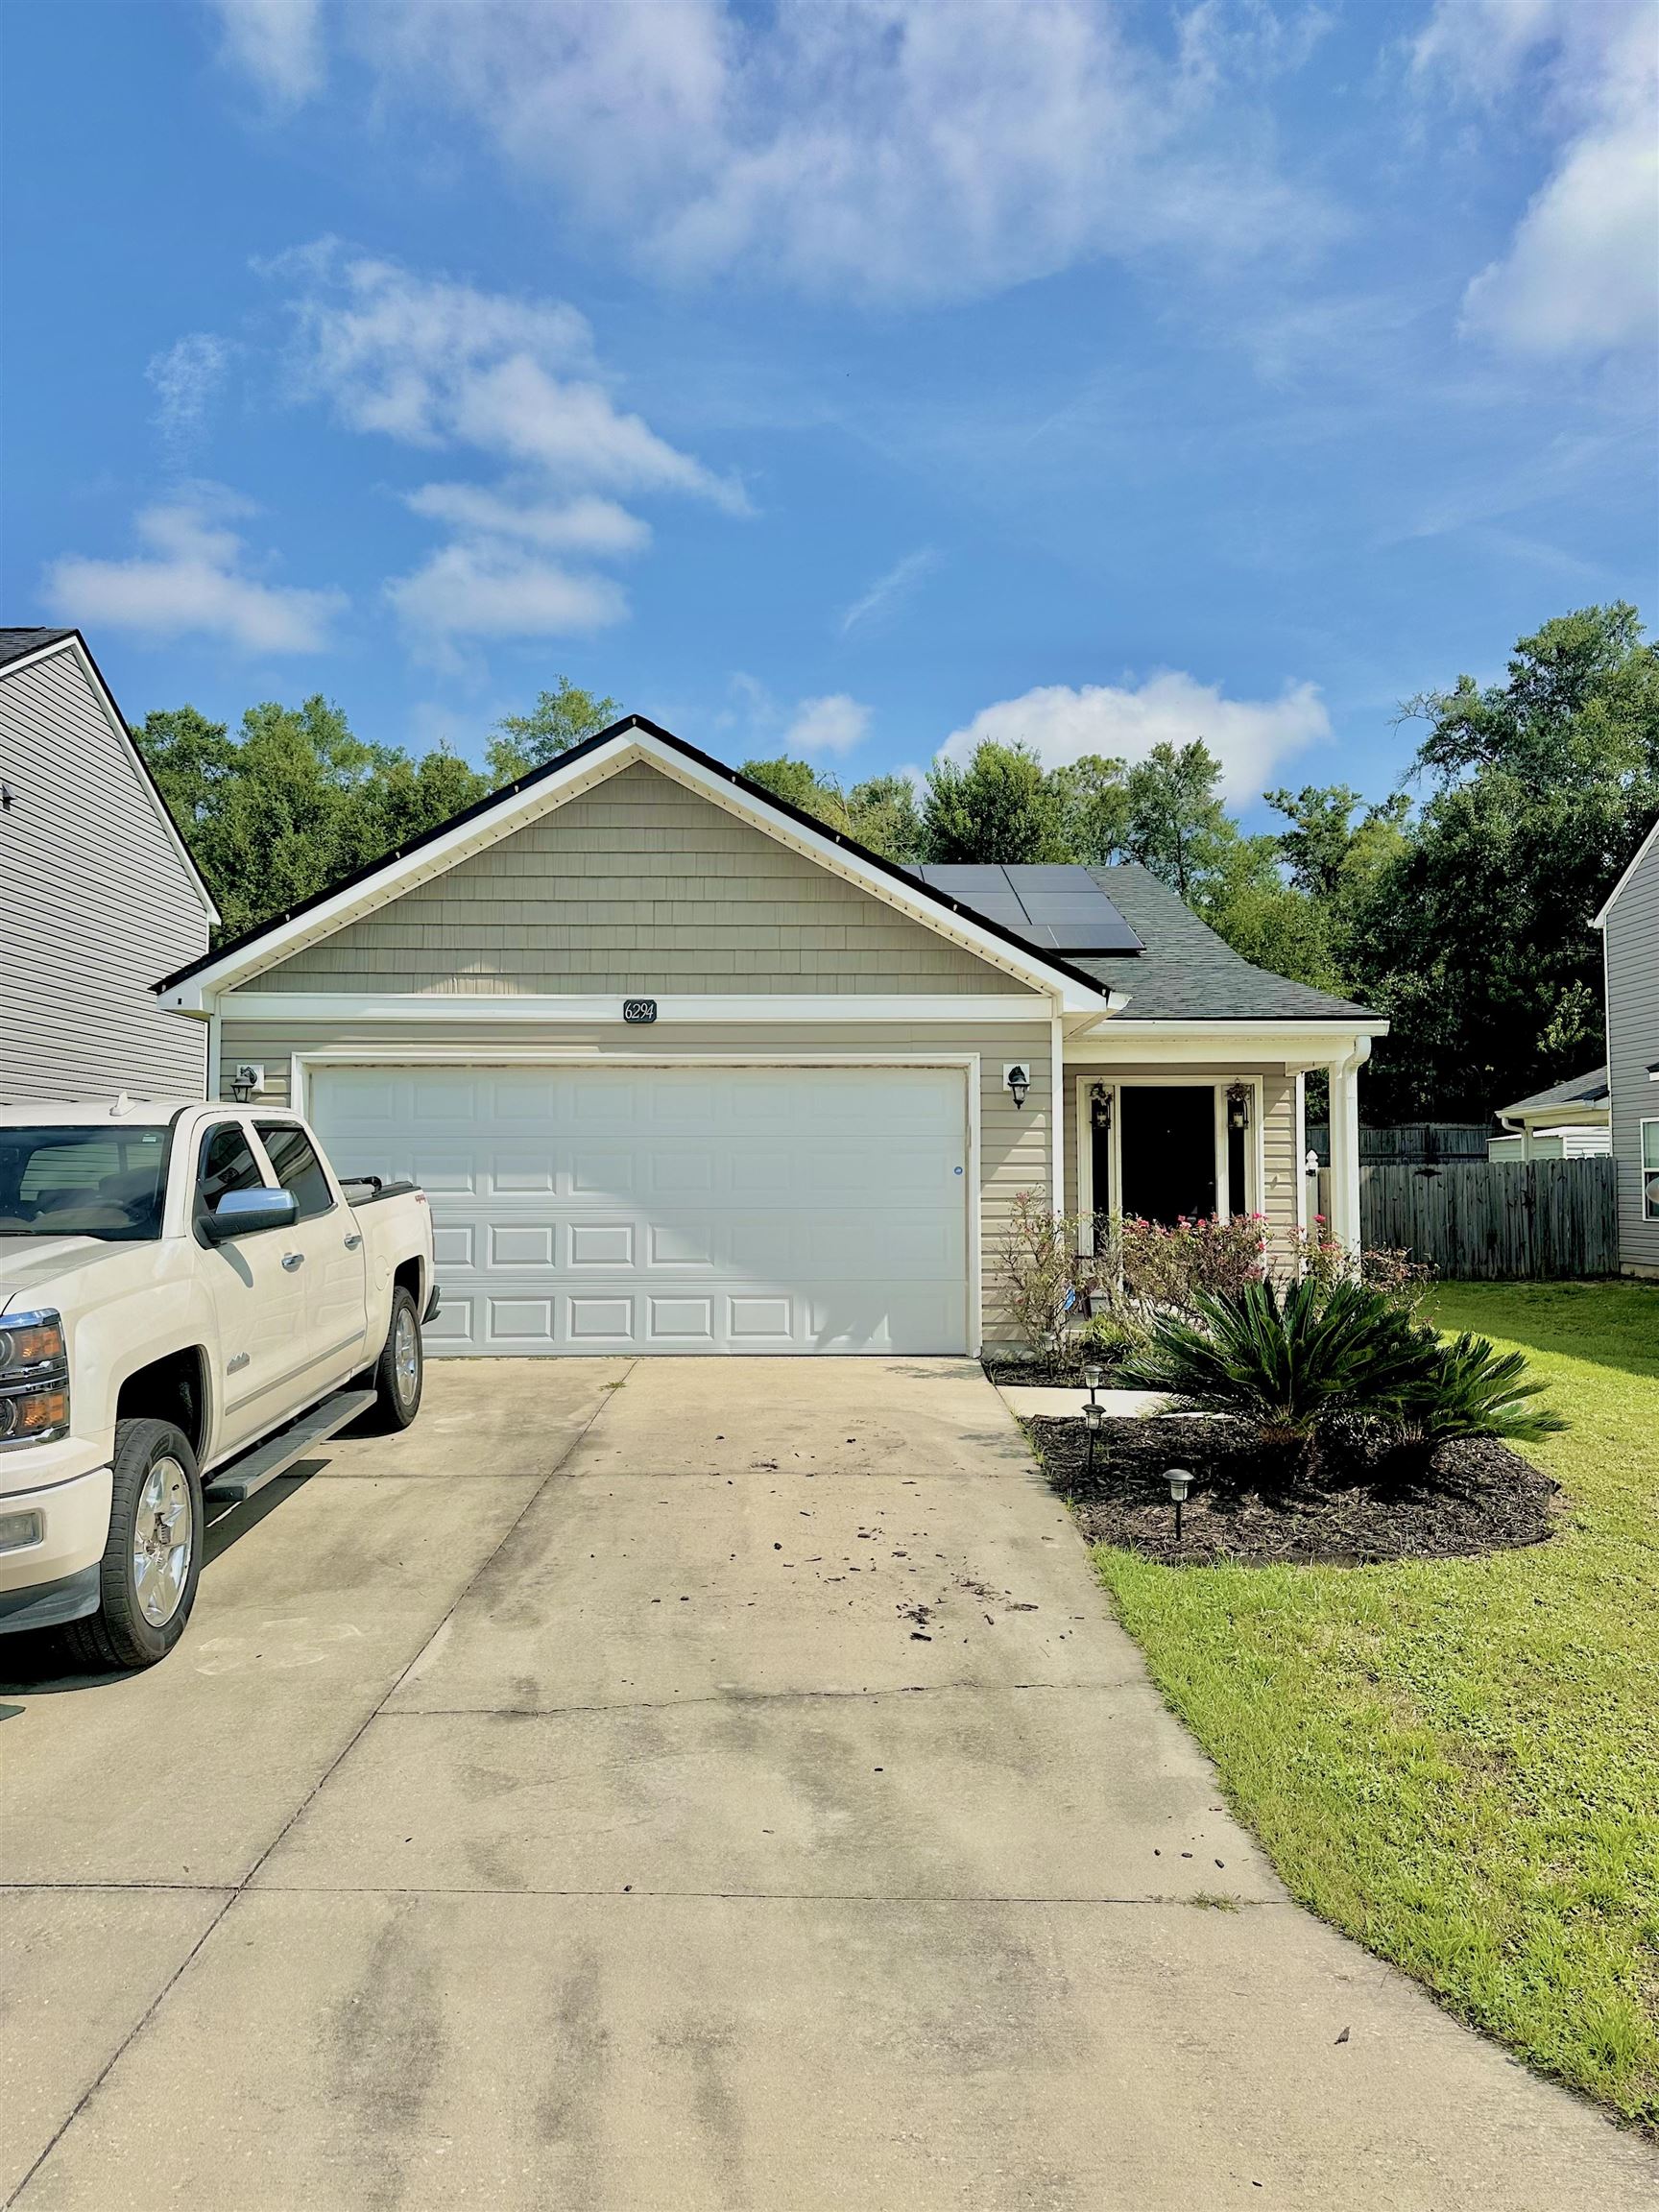
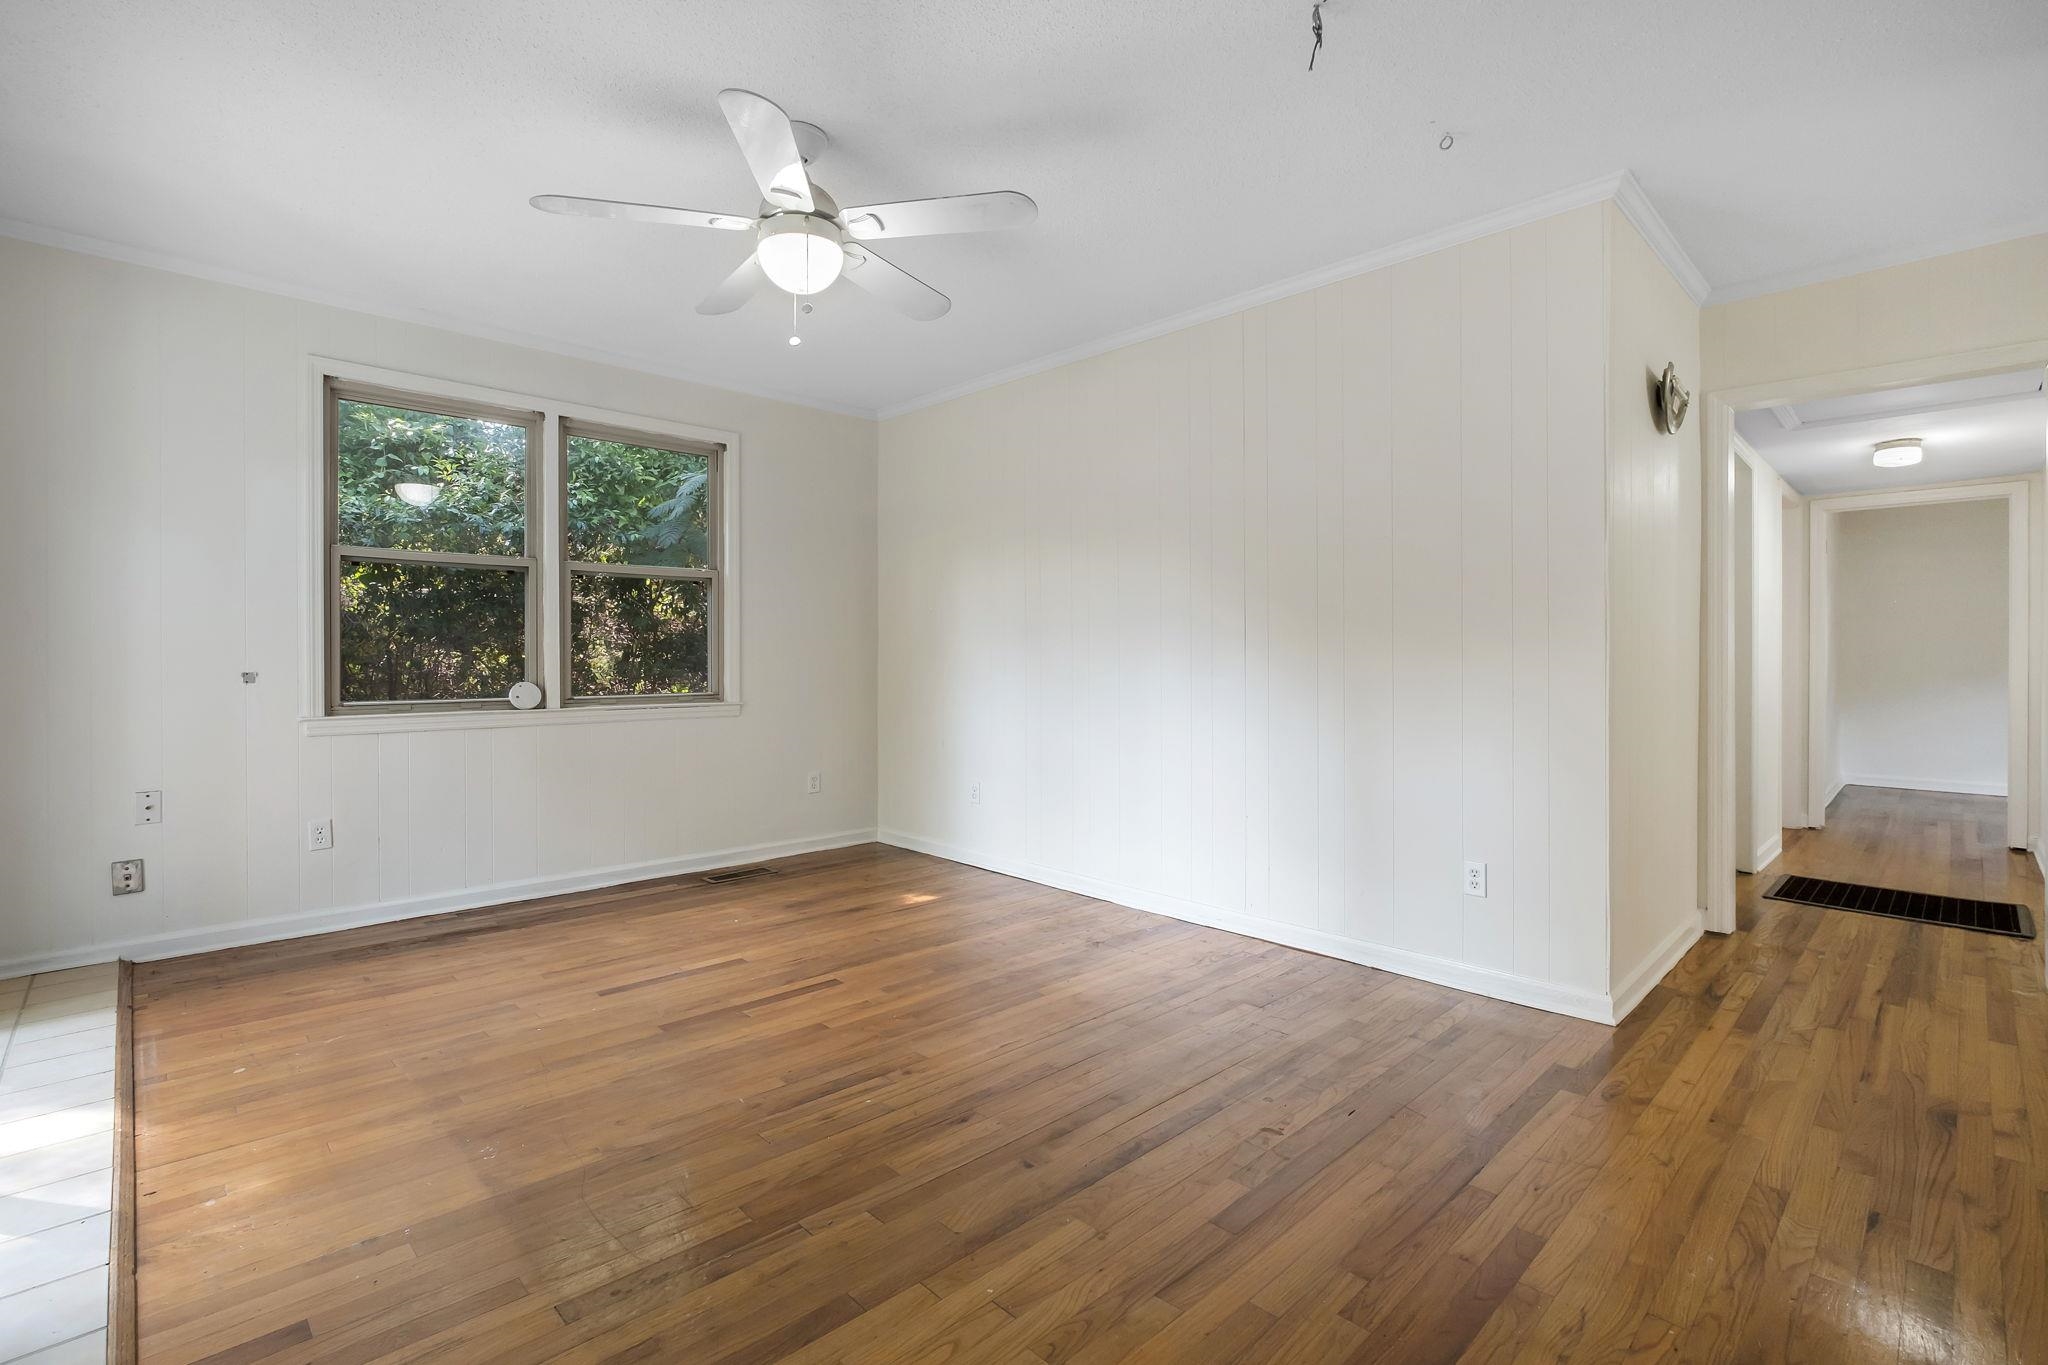
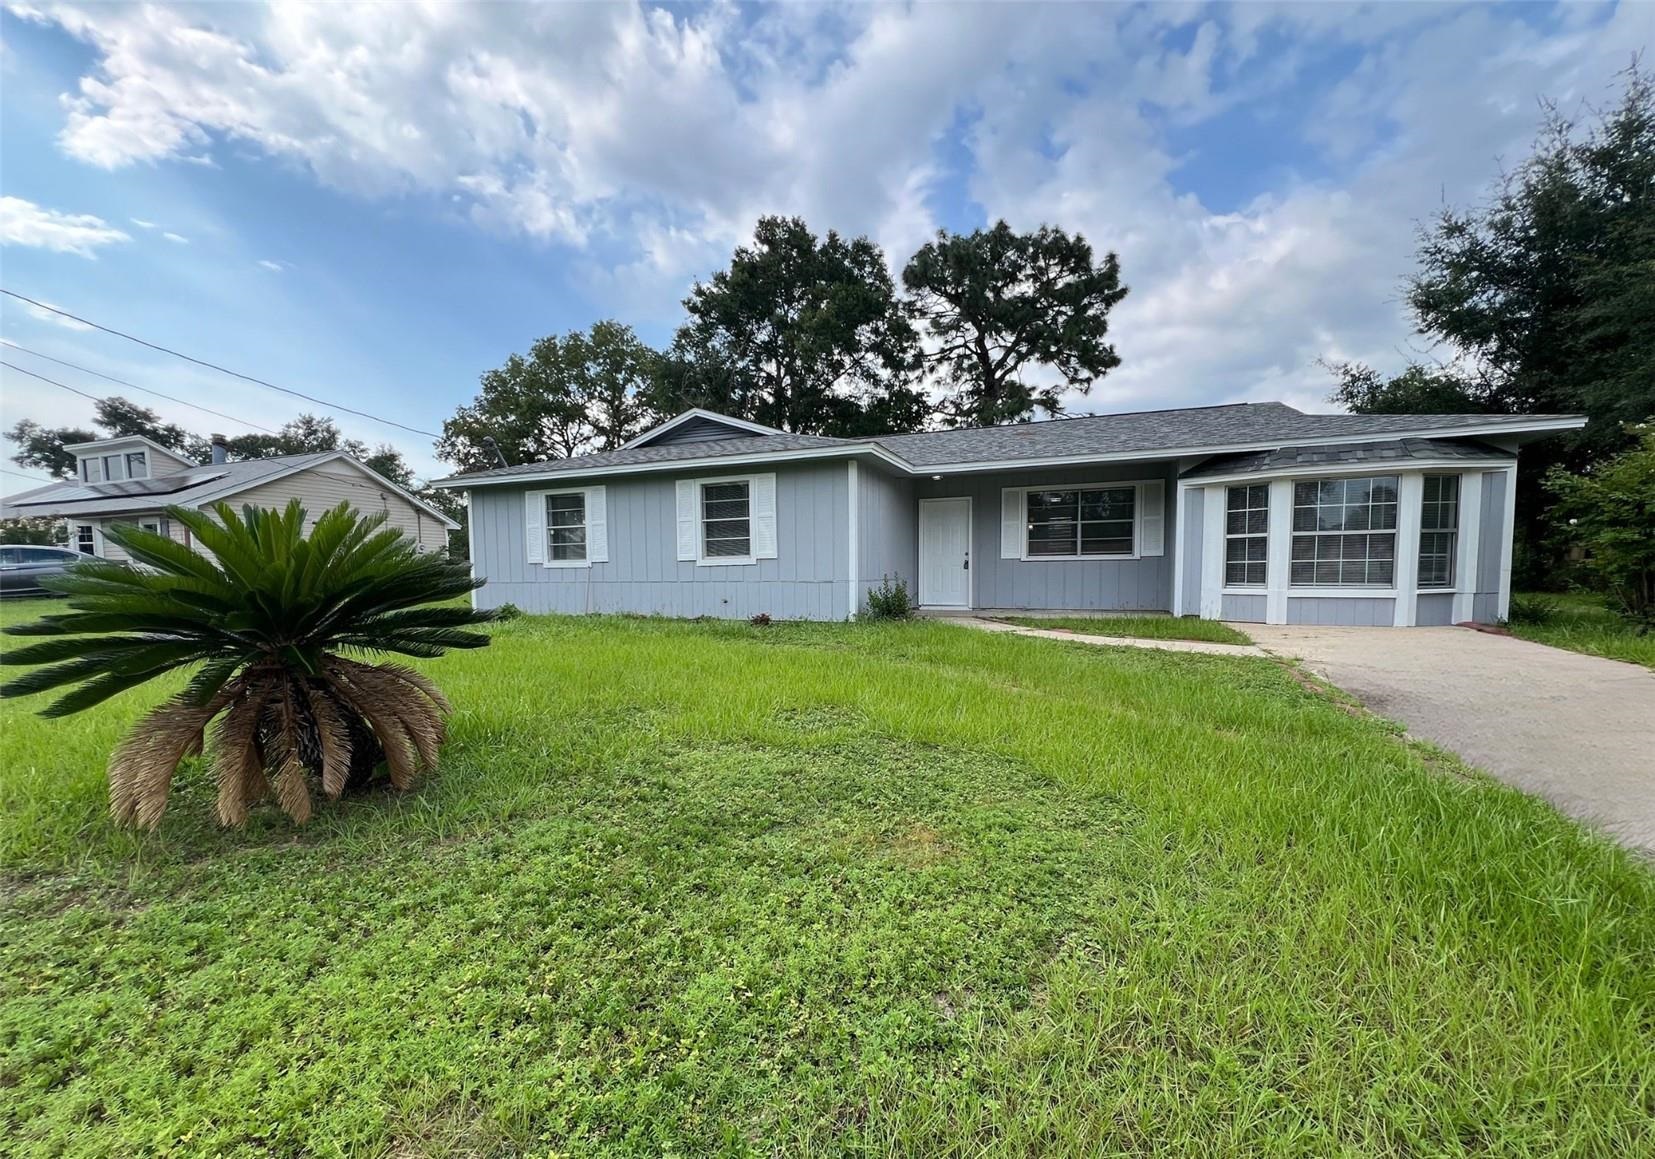
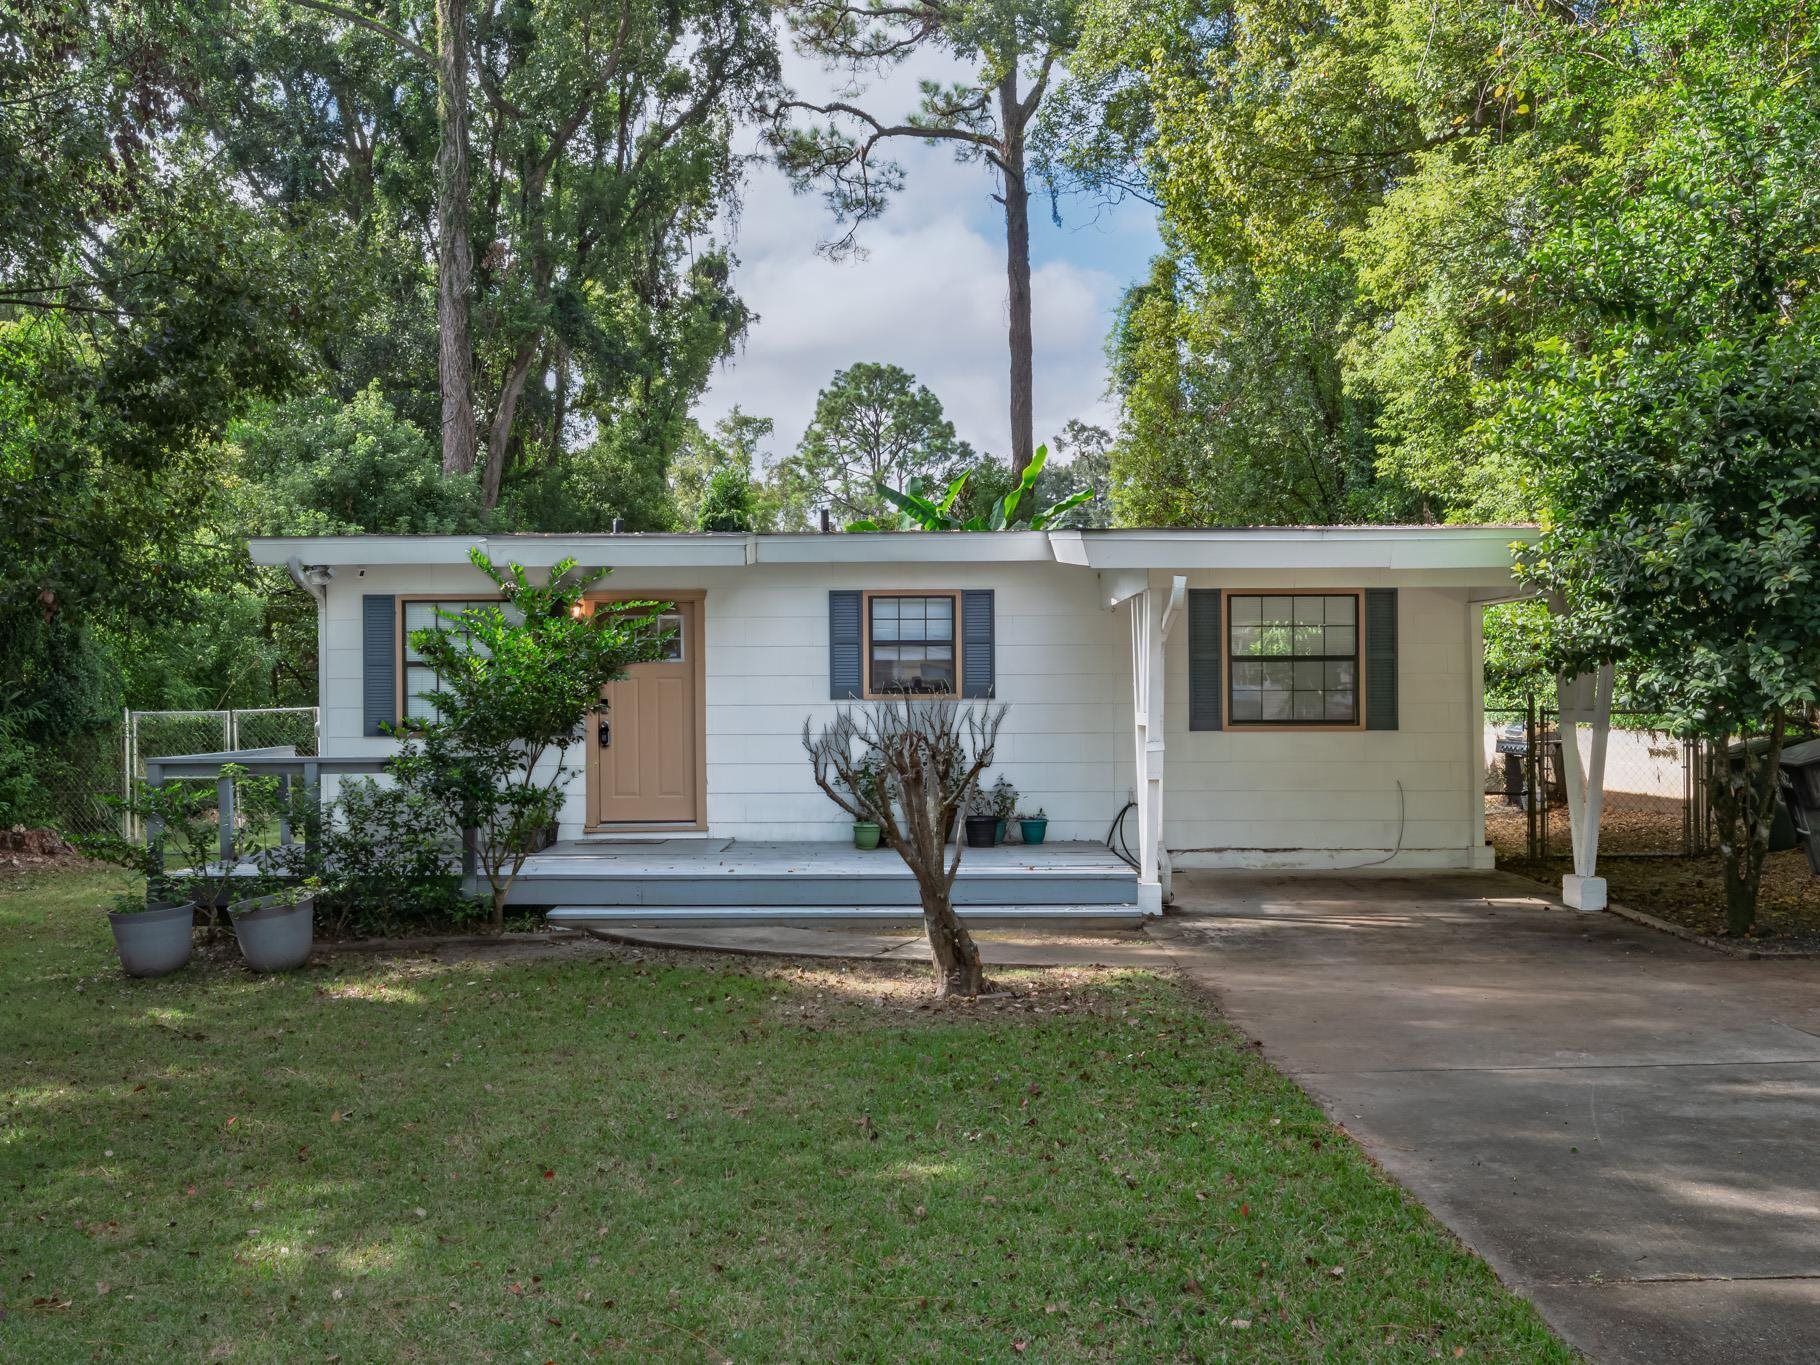
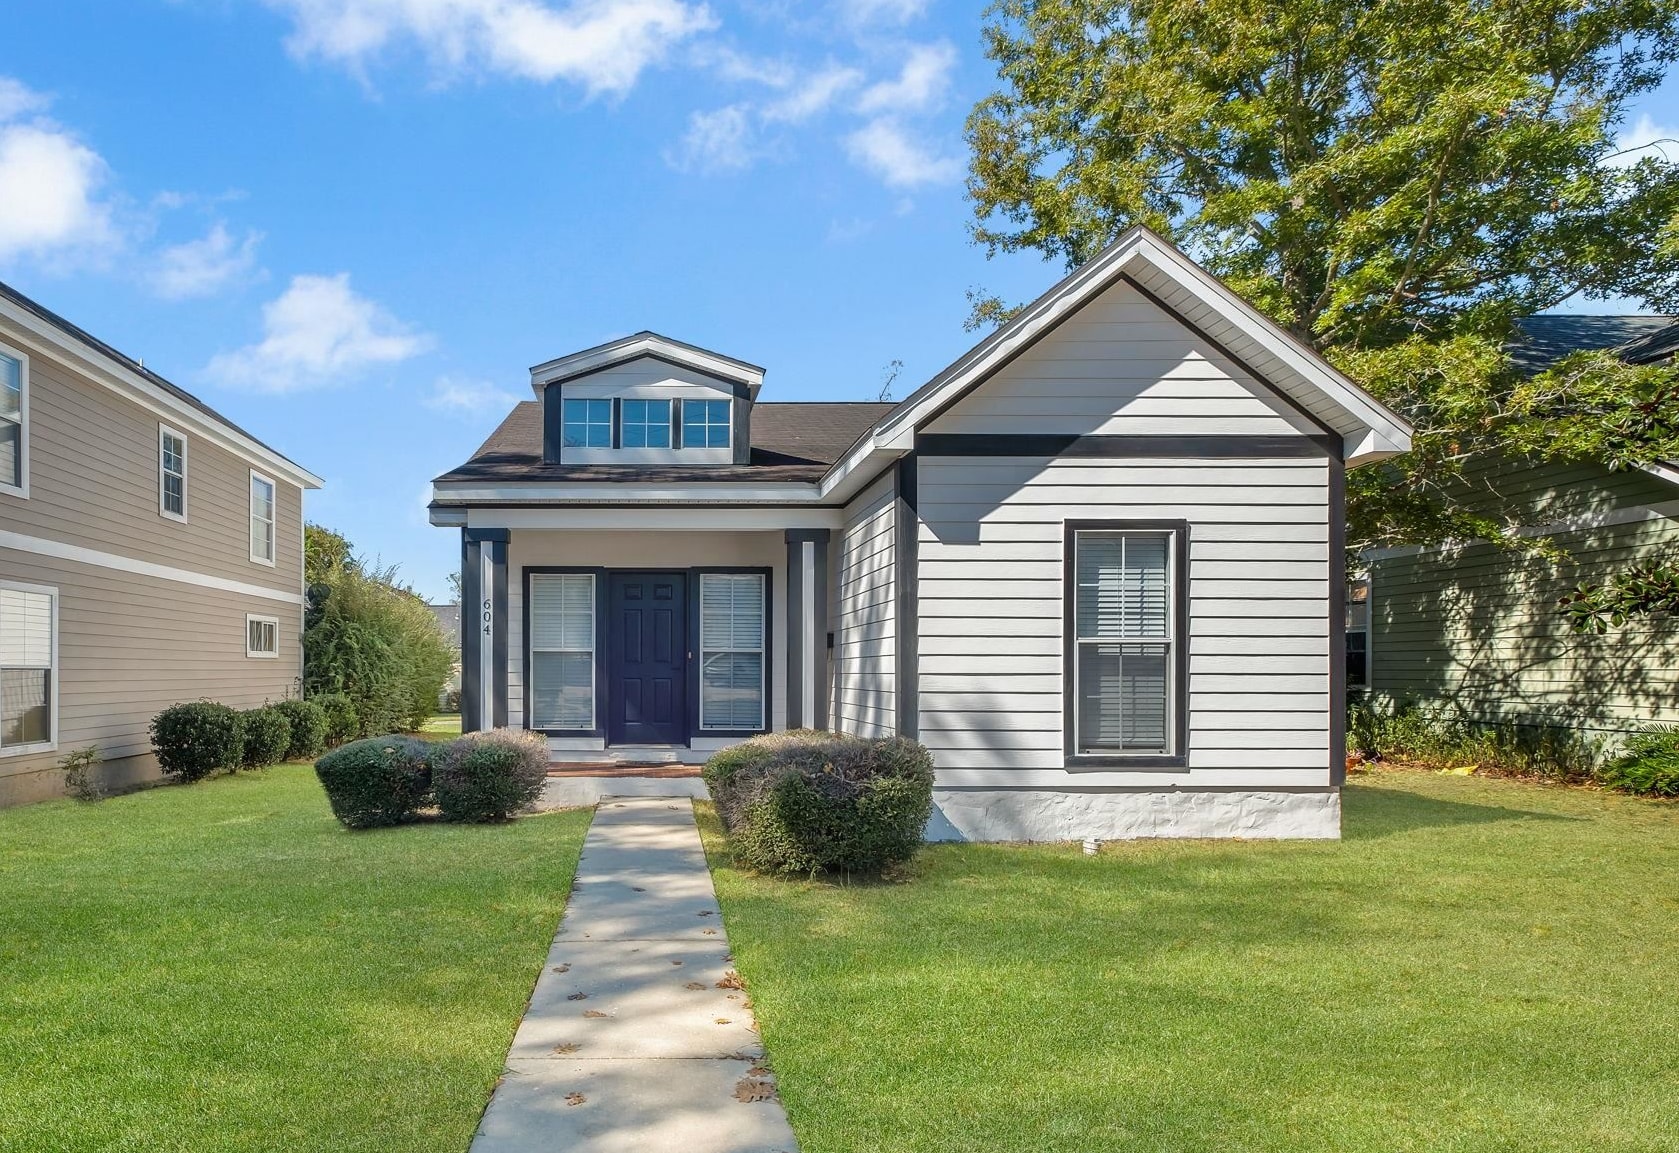
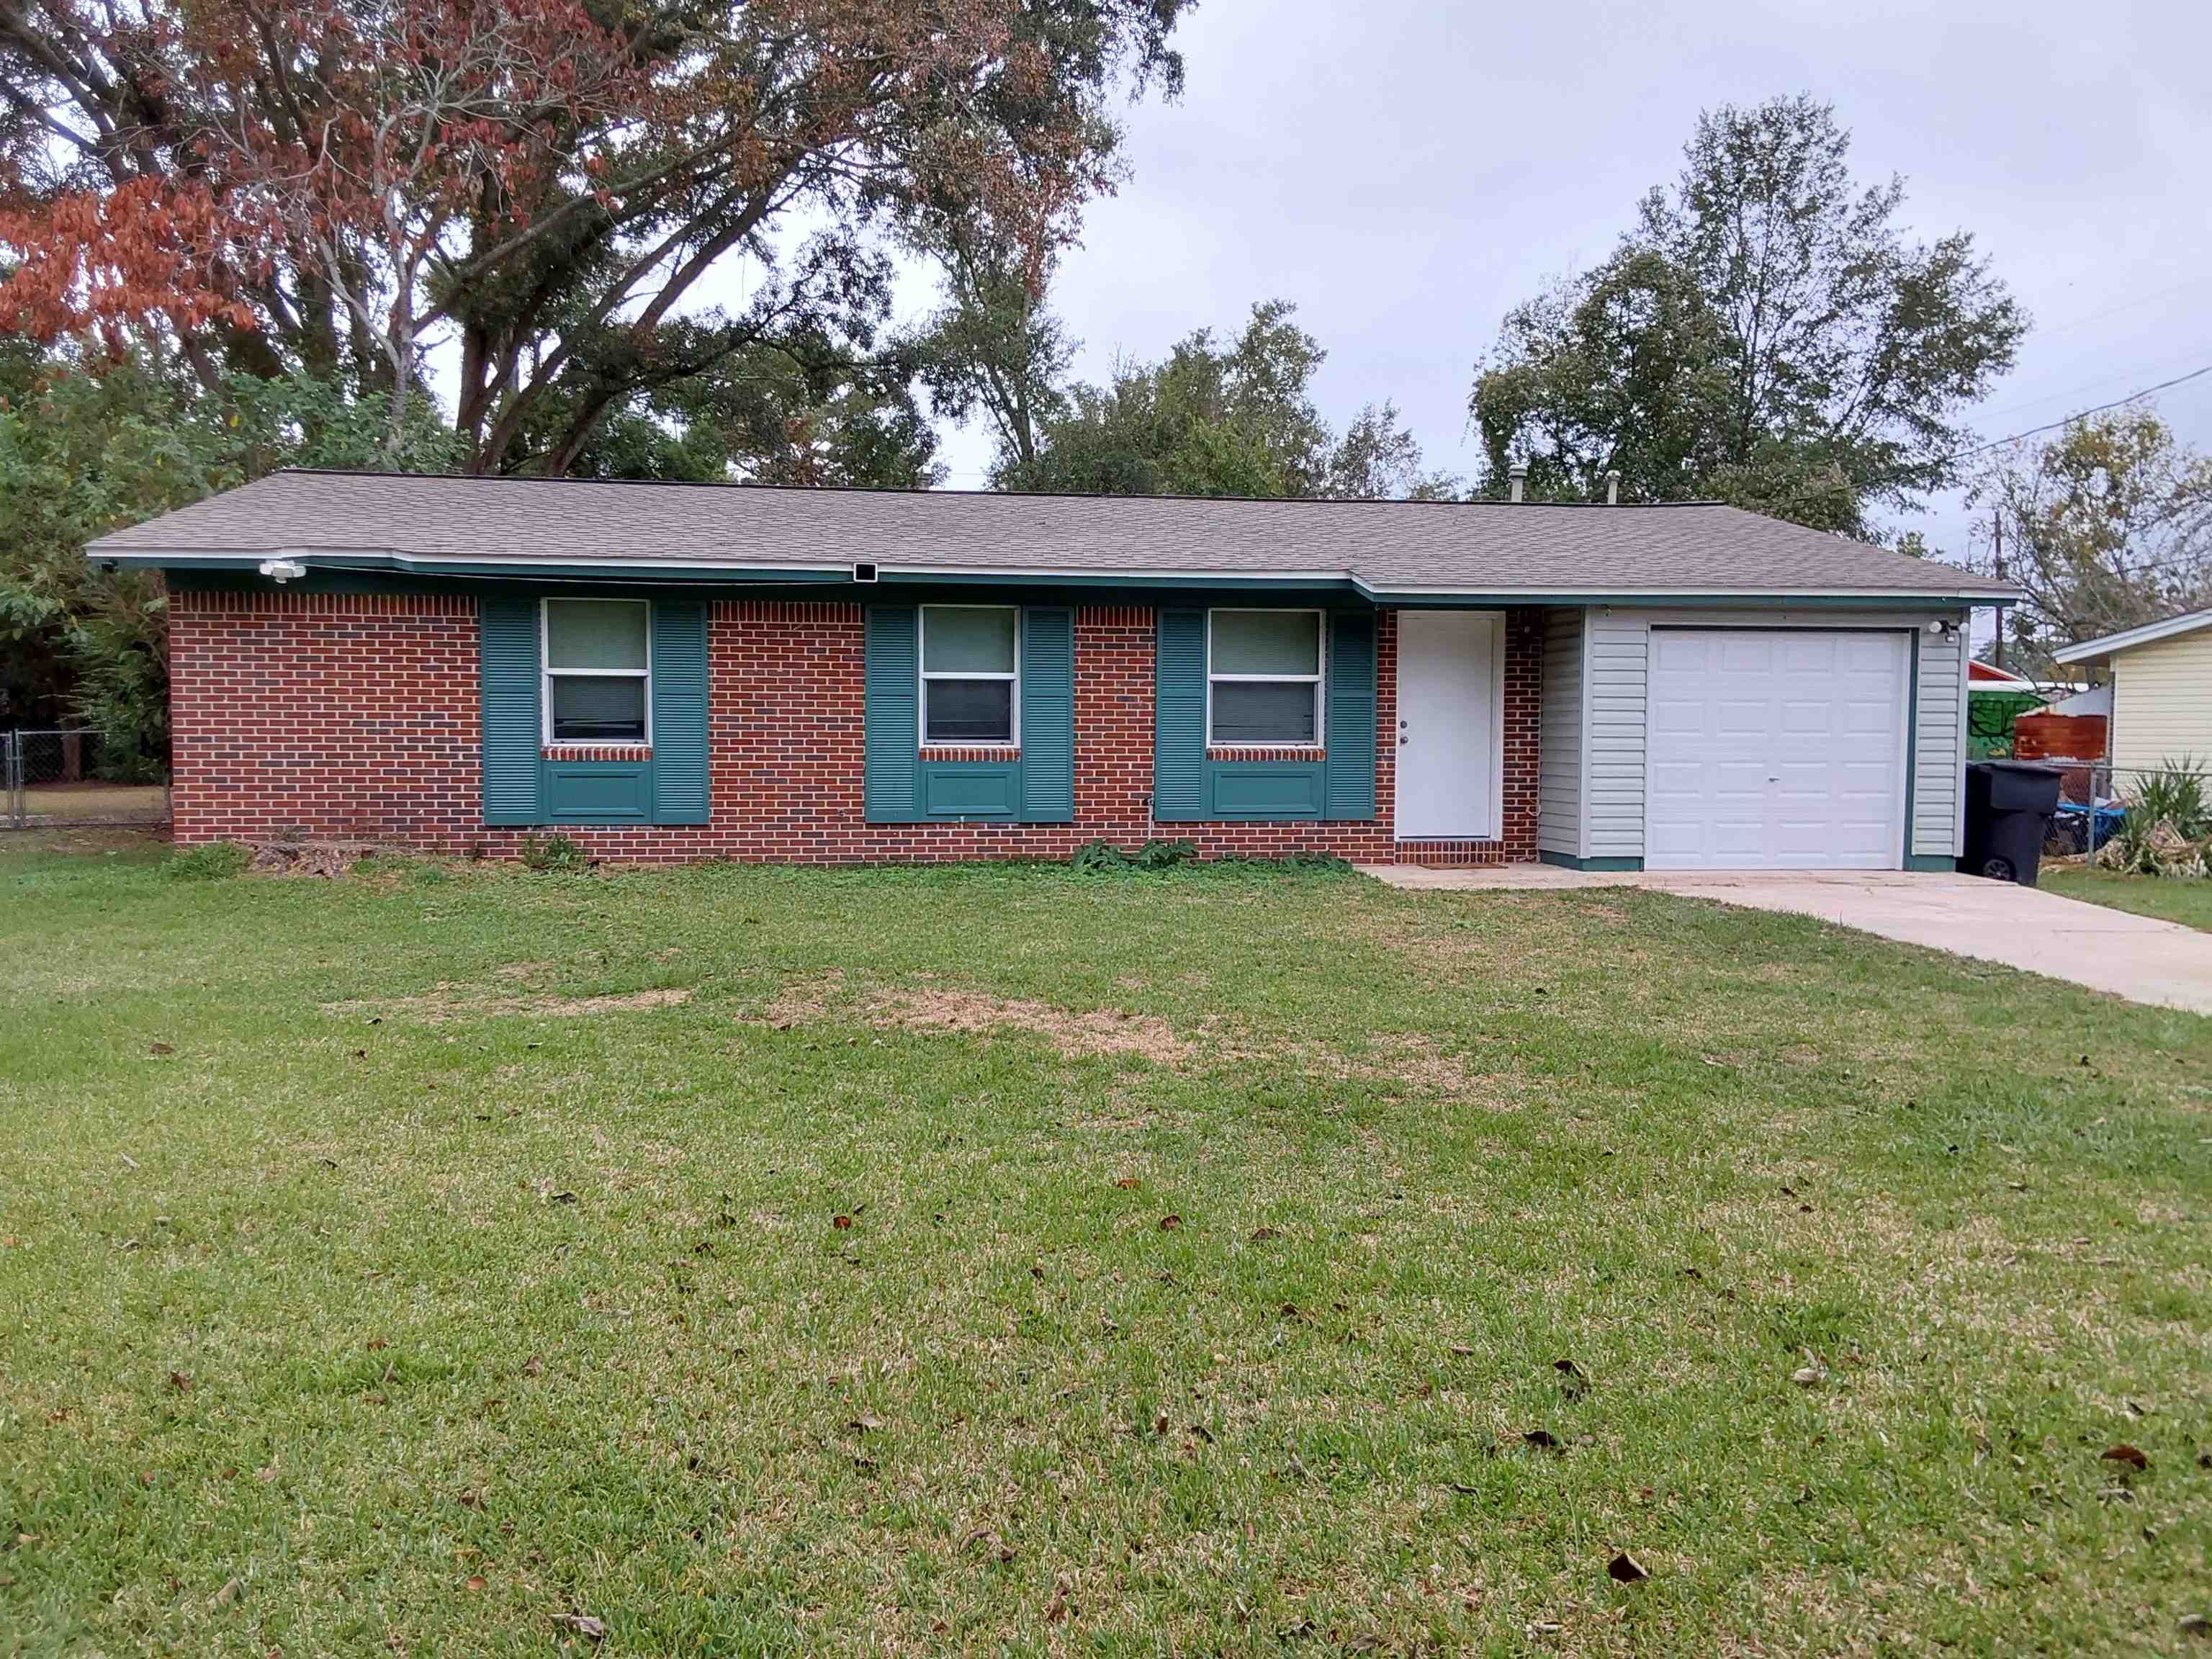
First, let’s take a look at the active listings priced near today’s median home price. Note how many of them are already under contract with a buyer. The market remains blistering hot!
Median Priced Homes For Sale In Tallahassee
Homes For Sale Priced Near The Median


In-Depth Video Report
Our first three graphs in the report segment the market by property type, allowing us to discern the median for single-family detached homes, townhomes, and condominiums.
Median Home Price
The first graph makes it very clear, the median home price is moving higher for each property type.

The first thing that catches my eye is that the median home price for single-family detached homes is at an all-time high, leaving the past high years well behind it. But that is not the case for the attached homes.
Here’s how the median home price has changed since the previous market peak in 2006:
- Single-Family Detached Homes: UP 16%
- Townhomes: DOWN 11%
- Condominiums: DOWN 26%
Today’s buyer is empowered with low mortgage interest rate loans and can spend more without blowing their monthly budget for home payments. Additionally, the relative supply of homes for sale has reached an all-time low, allowing sellers to demand more money for their homes.
Median Home Value
Much like the median home price, the median home value is moving higher for each property type.

Just as we saw with prices, single-family detached homes are finding new highs while the attached units are still in the recovery stage.
Here’s how the median home value has changed since the previous market peak in 2006:
- Single-Family Detached Homes: UP 8%
- Townhomes: DOWN 10%
- Condominiums: DOWN 20%
The market has always favored detached homes, but the disparity in the recovery in values (I believe) relates to the type of buyers in the market. Back in 2006, there was an unhealthy percentage of inorganic buyers (people who were not buying to use the property, rather they were speculating on flipping it for profit).
Plenty of buildings were converted to condominiums and the speculators had a grand old time until the market was glutted with supply and values started falling. This is clear in the graph.
Notice how townhomes are moving higher at a fairly steady pace, while the road to recovery for condominiums is much bumpier. The downtown condominium market still has a glut of supply and the COVID-19 pandemic served to reduce demand for vertical urban living spaces.
Median Home Size
This next graph tracks the median home size by property type.

I always like to include “size” graphs whenever we study prices and values. As a reminder, price reports show what buyers are spending, while value reports show what sellers are getting.
It’s not uncommon for prices and values to move at different paces, and sometimes they even move in opposite directions. The size graph serves to explain the differences.
The graph above shows that today’s buyer can afford, and is buying, larger homes. Again, buoyed by low mortgage interest rates, buyers can spend more money and are doing so, enabling them to buy “more home” than they could if interest rates were higher. We can expect to see the median home size come back down when interest rates reverse direction.
The first portion of our report segmented the market by property type, but the next three graphs segment the market by age (new versus existing).
Median Home Price
The next graph in today’s report shows the median home price of new homes (blue), existing homes (red), and then the overall median home price (gray).

The first thing that catches my attention when I look at the median home price graph is that homebuilders are working hard to keep the median new home price at a level that buyers can afford.
From 2013 through 2020, the median new home price has only moved about 5% higher. Contrast that with the resale market which has seen the median home price move 43% higher!
Today, the median new home price of $305K is 41% higher than the median existing-home price of $217K. Overall, Tallahassee median home price has moved to $229K.
Median Home Value
The next graph in today’s report shows the median home value of new homes (blue), existing homes (red), and then the overall median home value (gray).

I believe the best measurement for real estate appreciation in a market with sufficient sales is the movement of the median existing-home value over time. In 2020, existing homes appreciated at 9.3%, roughly three times the average we saw in the 1990s.
Note that the builders have been holding their costs fairly steady for the past three years. I’ll be curious to see how the 90%+ increase in the minimum wage over the next five years does to the cost of new homes and how that impacts the production of the homes our market so badly needs. I am not optimistic.
Go ahead and bookmark this report, and return to it in 2026. I forecast the medium (cost) value of new homes will be approaching $300 per square foot, causing the median new home price to be approaching $500K for a much smaller new home than today’s buyers are getting.
Median Home Size
The next graph in today’s report shows the median home size of new homes (blue), existing homes (red), and then the overall median home size (gray).

When I look at this graph, I immediately see how builders (blue bars) respond to changing market conditions. When the market was at its peak in 2006, the median home size was at its smallest. Following the market bottom in 2012, the homes in 2013 were the largest.
Simply put, when builders are struggling, they deliver more house for the money. And the opposite is true when times are good, you pay more for the homes. With this in mind, I expect to see the median home size for new homes decline over the next three or more years.
Real Estate Appreciation
The final graph in this report provides a great visual of how homes are appreciating in Tallahassee.

This graph really puts some perspective on the diminished inventory of homes for sale. The market has been undersupplied since the end of 2016, and we’re really starting to see home values push higher at a faster rate.
Unless builders double their production (even more are needed) in 2021, I am expecting to see double-digit appreciation. The relative supply of homes is going to reach new lows, and the bidding wars are going to extend to more price ranges than we have seen in the past.
For our readers who are concerned with a market collapse, I have embedded a video below where I addressed these concerns.
Will There Be A Housing Bubble In 2021?
When moving to, in, or from Tallahassee, you will fare better if you work with a local expert. We are here to help. If you have further questions on the Tallahassee real estate market, you can leave a comment below, give us a call at (850) 366-8917, or drop us a note and we'll give you the local information needed to ensure a successful, smooth transaction.
As a local born and raised in Tallahassee with a focus on customer service, I promise you'll find great success when working with Joe Manausa Real Estate, just as have our past customers. You can read thousands of their reviews reported on Google, Facebook and Zillow right here: Real Estate Agent Reviews Tallahassee.
 Have you heard about my new book "The Business of Getting Business?" It's a comprehensive guide for small businesses to help them make the move to digital. For those of us who want to survive and thrive in a world where large corporations are taking over, it is a must-read. It's also the perfect guide for how to sell a home in the digital age. You can find The Business Of Getting Business by clicking on any of the trusted retailers below.

Think all REALTORS are alike?
Read what people are saying about working with Joe Manausa Real Estate! You can see thousands of real customer reviews reported on Google, Facebook and Zillow at this link: CLICK HERE FOR REAL ESTATE AGENT REVIEWS.
