 October is over, we’re through ten months of this crazy 2020 year, and it’s time for a new housing market update.
As I have reported in recent reports, the housing market is behaving more like we’d expect in the Summer as opposed to normal October and November conditions.
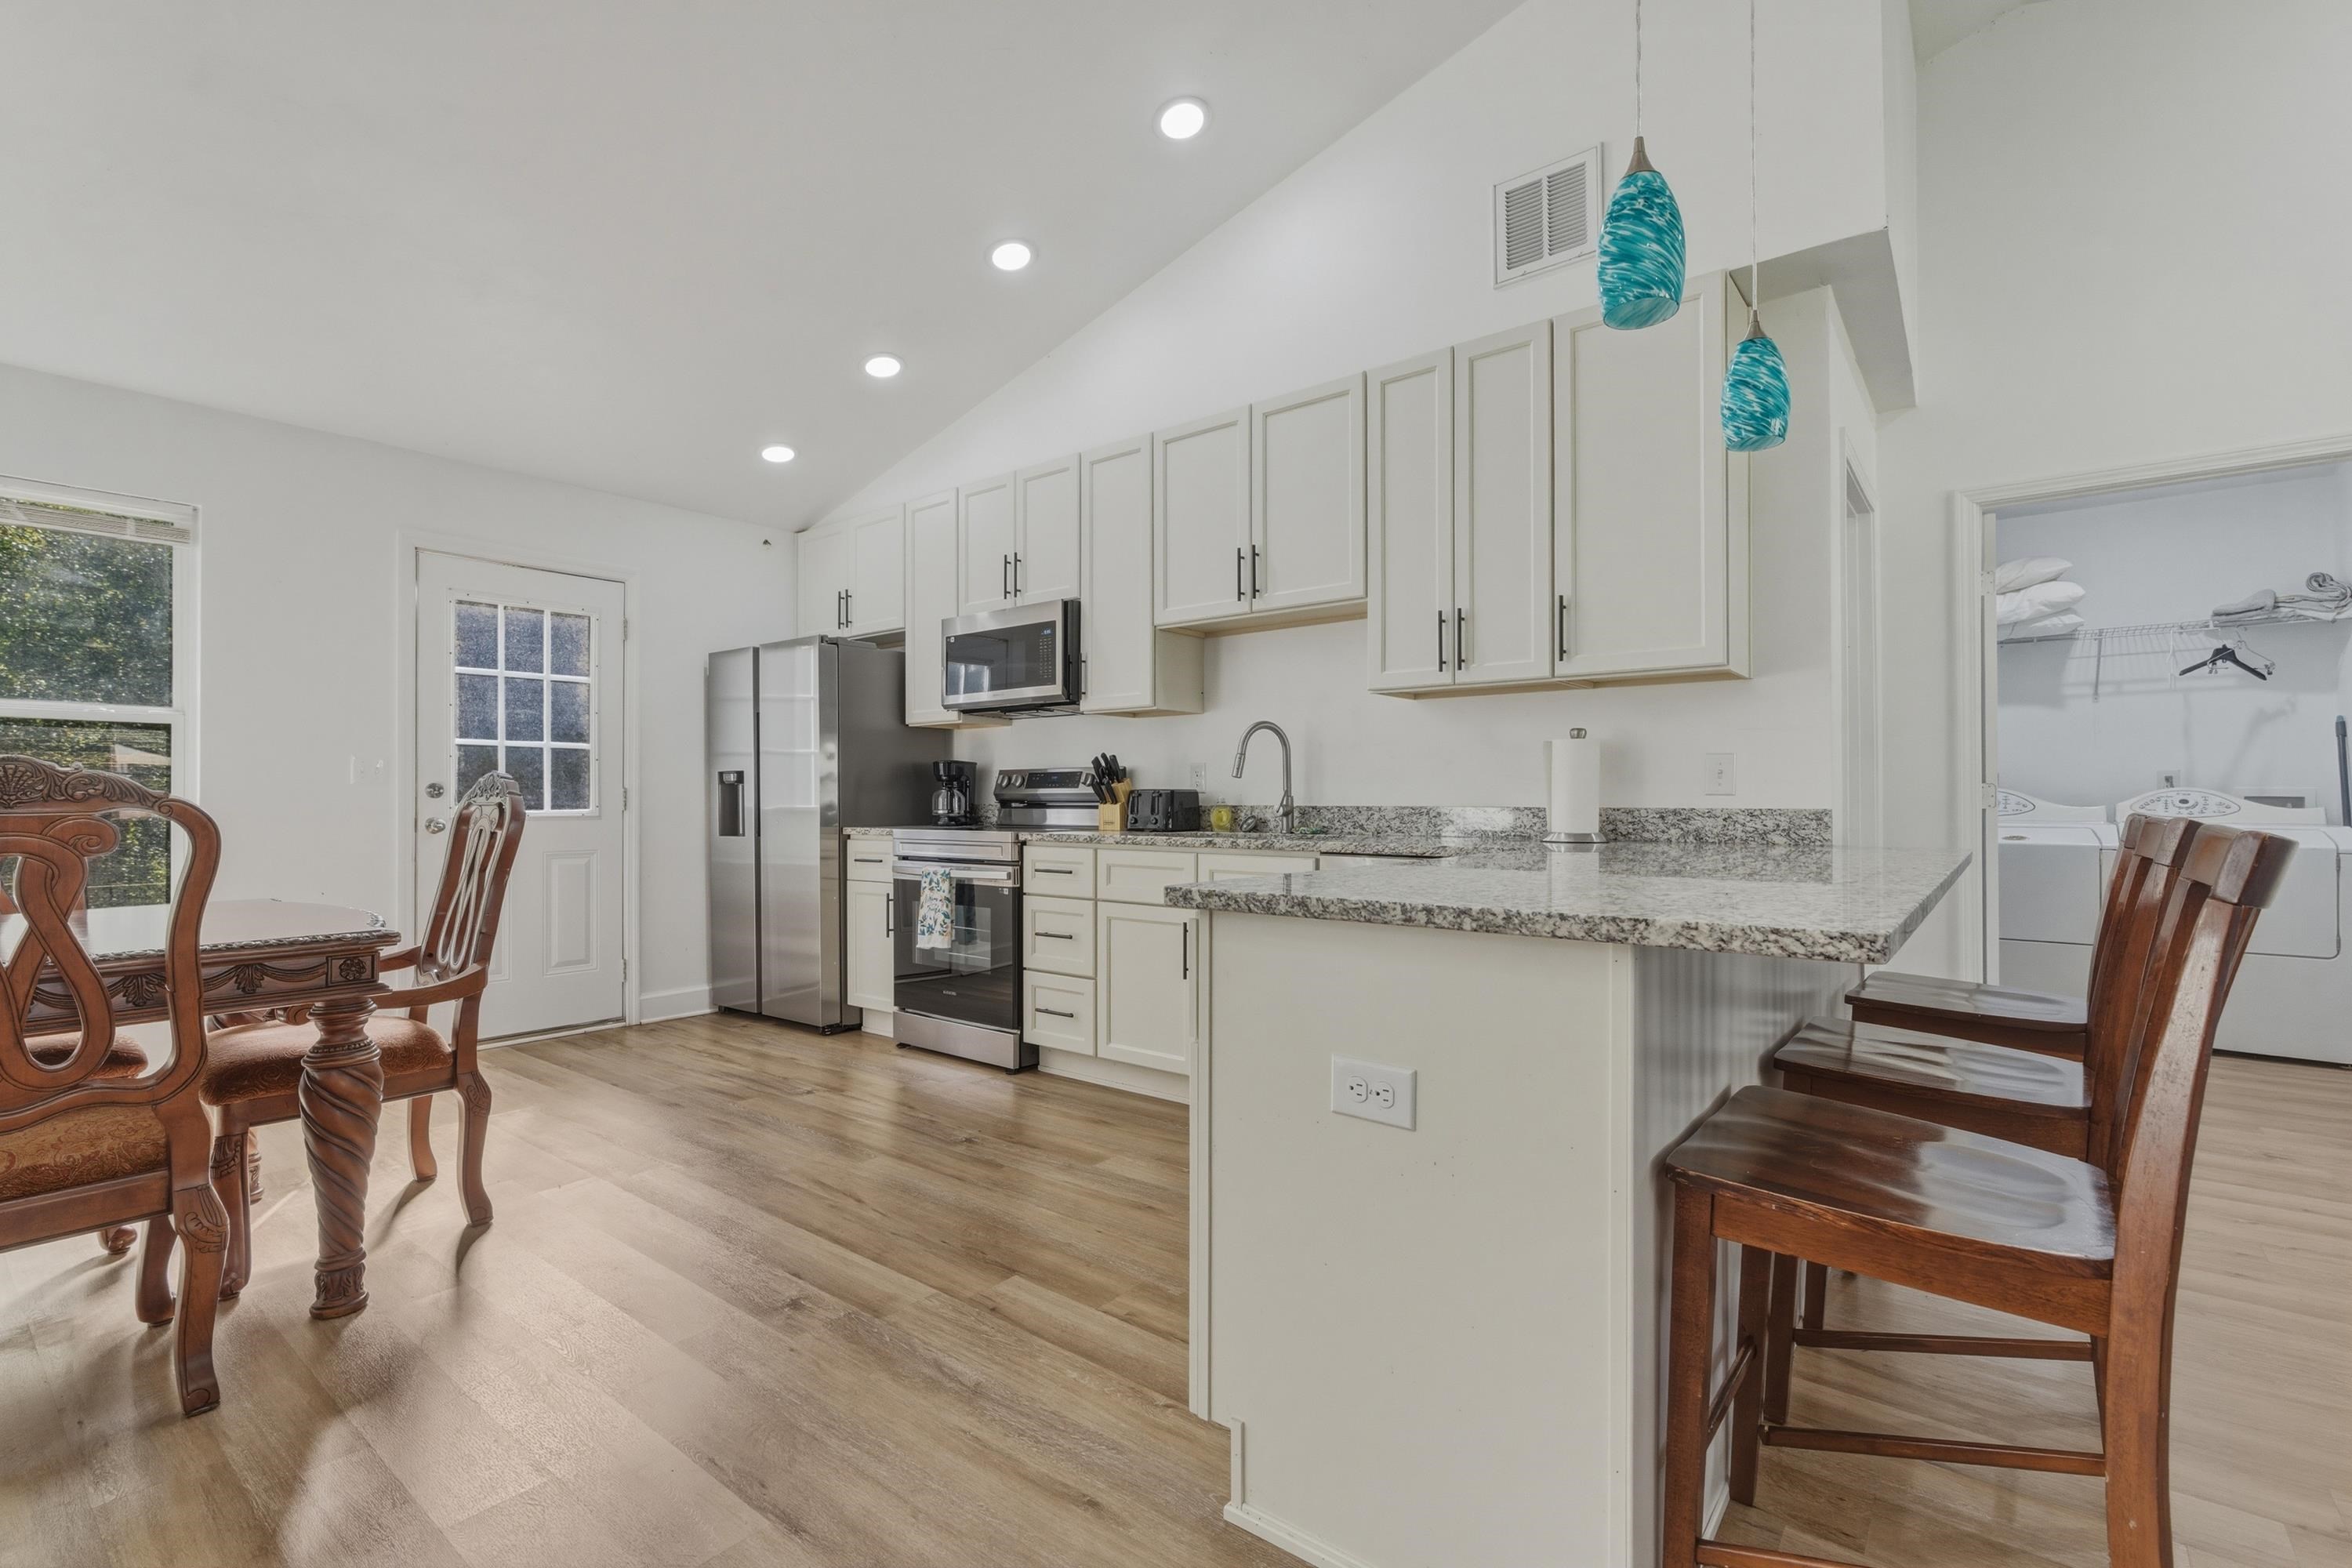
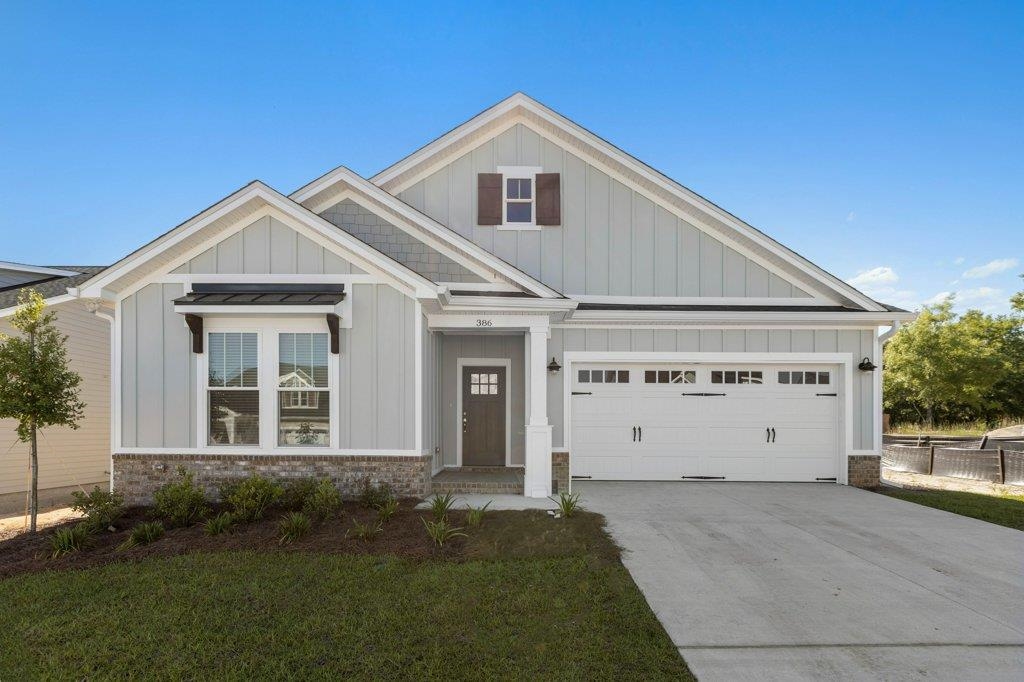
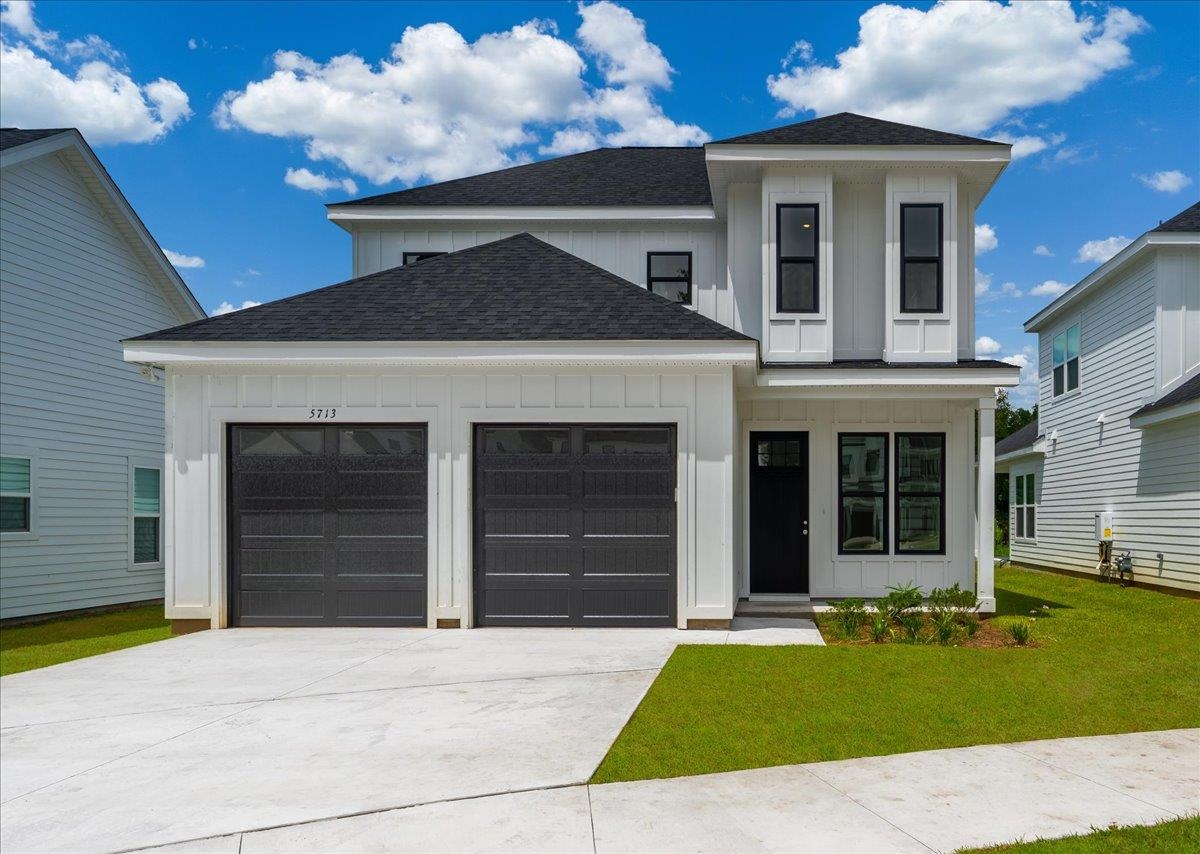
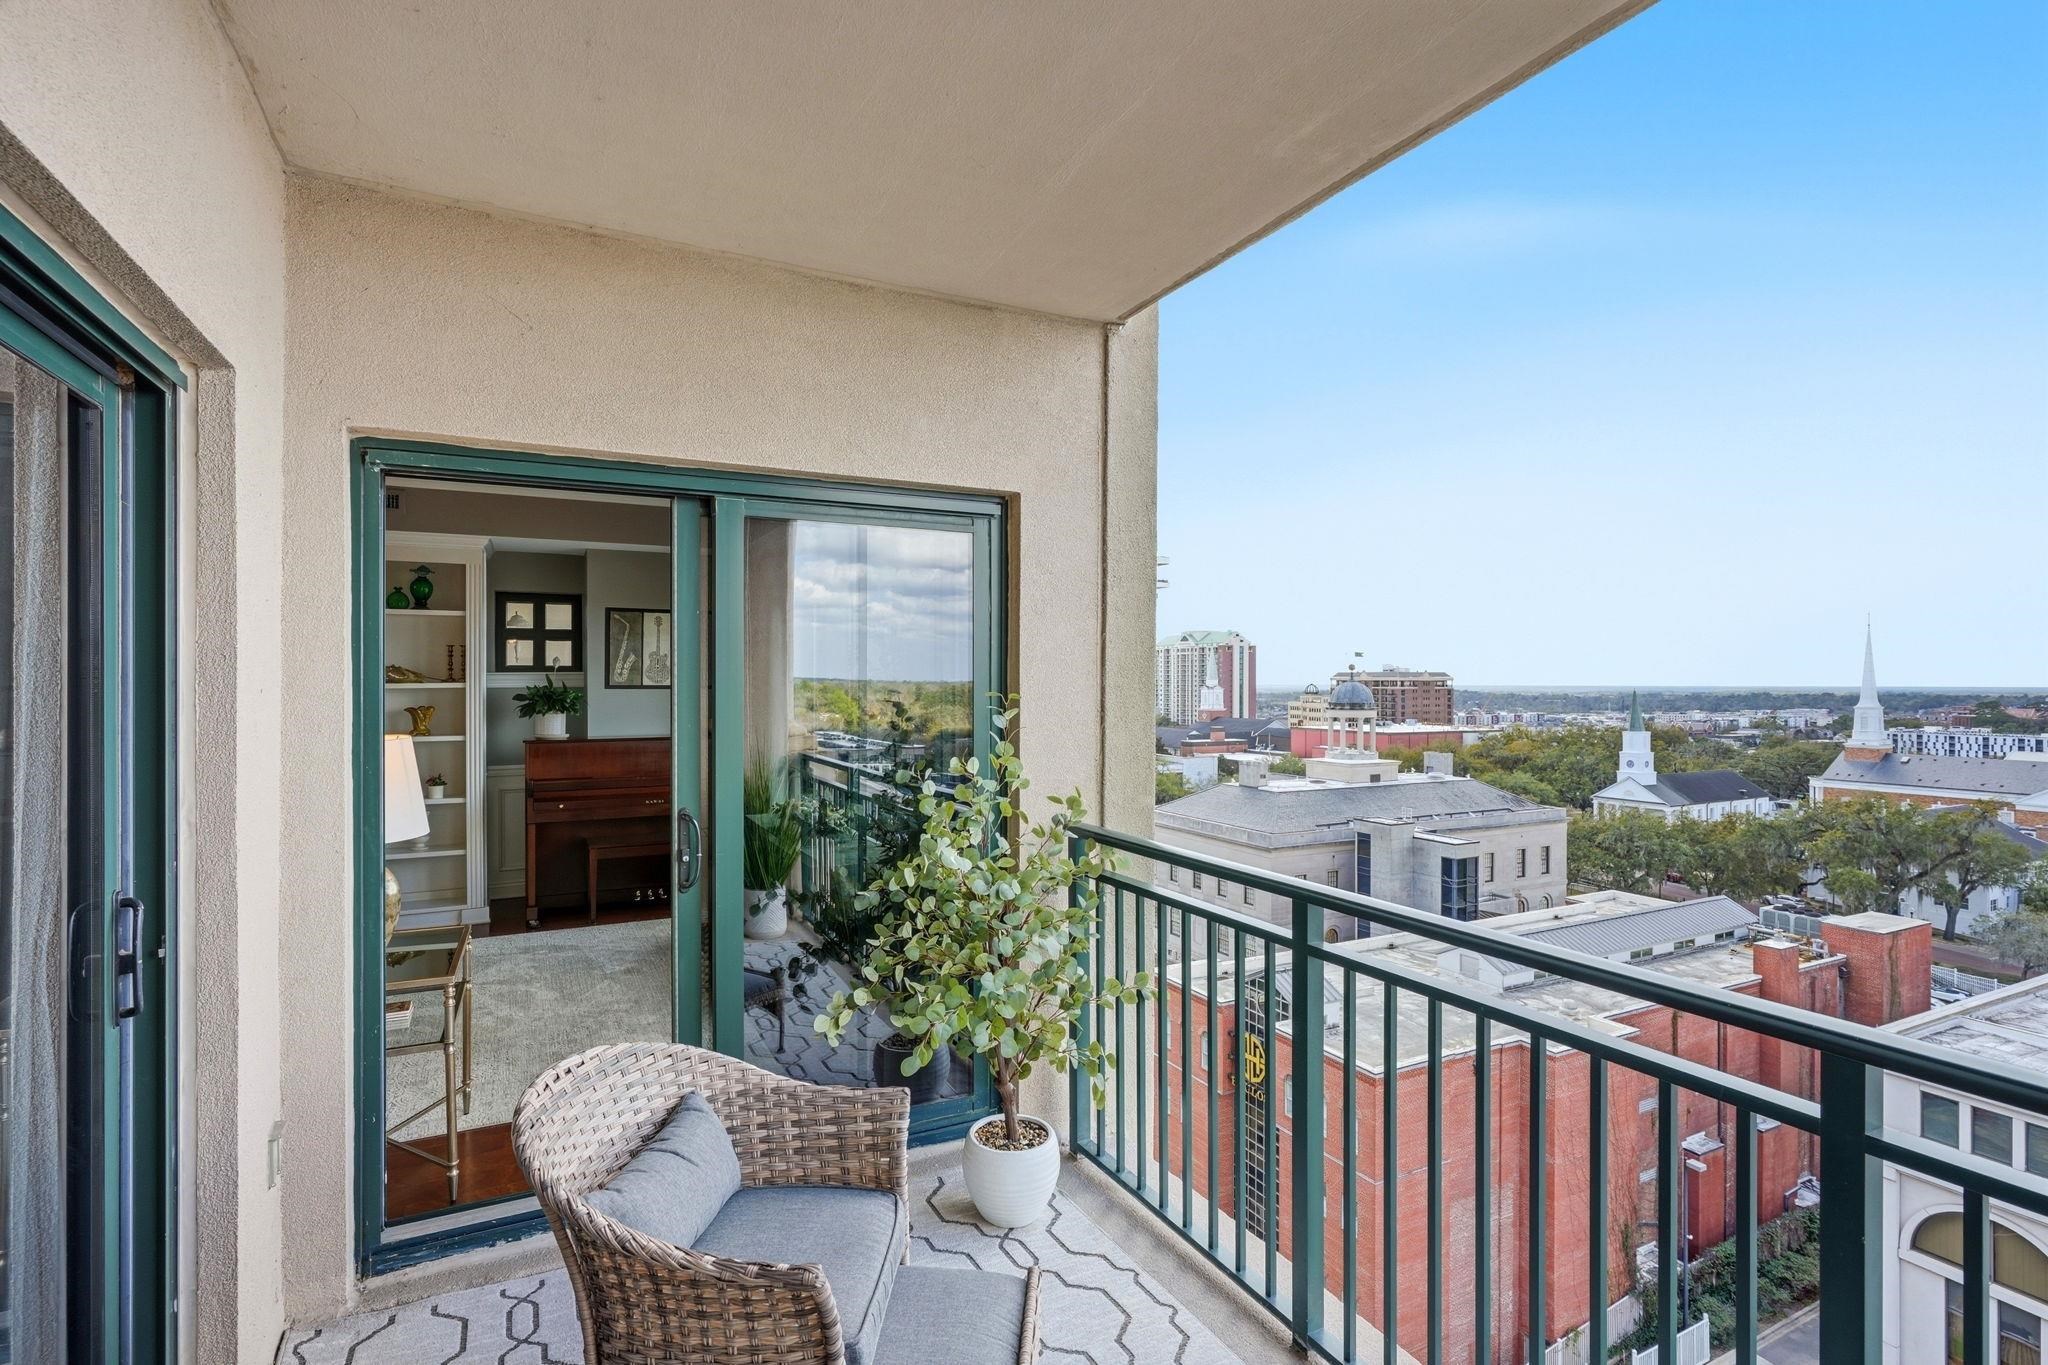
So just how busy is the market? Check out the following list of homes for sale in Tallahassee and you will find that nearly 1/2 of them are already under contract with buyers.
Listings In The Tallahassee Housing Market
Tallahassee Homes for Sale


Housing Report Video
November 2020 Housing Market Report
Our November 2020 housing market report begins with a look at the big picture first and then narrows to specific conditions that will be very important to you if you sell or buy a home.
Our first graph shows just how explosive home sales were in October.
Year Over Year Home Sales
Each month’s home sales are compared with the corresponding month from the year prior. For this reason, it’s called the year-over-year home sales graph.

Year over year home sales rose nearly 18% in October. Now if you saw our year-over-year housing report we published last week, you might wonder how this has changed so dramatically.
Real estate agents are not always timely in their reporting, so it usually takes a few weeks (and sometimes months) for them to report home sales through the MLS.
Because of this, we’re always seeing minor adjustments in past data.
Now, with 18% growth already in the books in October, you might wonder what’s going on right now in early November.
I can tell you from street level too that for every one buyer that closed on a home in October, there was more than one that missed out on a home and was left hoping to find a home to close on in November.
Demand remains strong. There are not enough homes for sale to satisfy buyers today.
We need more sellers to enter the market, whether this comes from existing homes or the new homes market, we need more inventory.
Year To Date Home Sales
The next graph shows the number of homes sold during the first ten months of each year. It allows us to compare the real estate market at the end of October with 18 previous years (each through October as well).

Home sales are down about 1/2% in 2020 when compared to 2019 (through October), a difference of only 23 homes!
When we compare 2020 to the past 18 years, 2020 trails just five other years.
Housing Market Activity
This graph computes the relative supply of homes based upon the trend of both supply and demand.
It shows the supply of homes relative to the current rate of demand so we call it the relative supply of homes. We measure relative supply in “months of supply,” meaning the number of months it would take to consume the current supply of homes for sale.

Here we see the green line shows the number of homes sold each month (that’s the demand) and the red line shows the number of homes for sale each month (that’s the supply). When we divided the demand into the supply, the result gives us the relative supply of homes shown in blue.
Finally, we take the one-year average of the relative supply to remove seasonality and we can see this plotted in yellow. When the market is balanced, we refer to it as market equilibrium.
Most real estate experts consider equilibrium, or a balanced market, as one with 6.0 months of supply of homes for sale. Look at how glutted the market was from 2006 through 2014, where the relative supply of homes peaked at nearly 14 months of supply. We spent very little time at equilibrium and now for the past 6 years, the overall market has favored home sellers.
I cover this graph in more detail in the video that goes along with this report.
Relative Supply Of Homes For Sale
The following table shows the relative supply of homes for sale in Tallahassee. Again, this merely means the supply of homes for sale relative to the current rate of demand.

The relative supply of homes is a number that shows us the months of supply of homes for sale (the supply of homes relative to the current rate of demand). A measure of 6.0 is traditionally considered a balanced market, where neither sellers nor buyers have an advantage in the market.
When the relative supply drops below 6.0, the market moves to a seller’s market. The opposite is true when the number grows above 6.0 and the market moves to favor buyers.
In the table above, the red cells show sellers’ market conditions, while the orange cells show buyers’ market conditions.
Overall, the entire market is undersupplied and all four quadrants in Tallahassee are in a sellers’ market. There remain many different pockets where a buyer’s market exists.
Overall, homes priced under $550K are enjoying a seller’s market, and you can be sure if you find one that stands out, it will be receiving offers from multiple buyers as soon as it hits the market (that’s why you want to hire a real estate agent that will make your home stand out!).
Luxury Homes Market
This graph is identical to the home sales activity graph we examined previously, with the exception of this one is limited to homes priced above $600K.

Unlike the lower-priced homes in the bottom 90% of the market, the top of the market remains in control of buyers. There are far more high-end homes for sale than there are high-end buyers.
The luxury market continues to improve though and we are enjoying the best conditions for selling a luxury home in Tallahassee that we have measured over the past 18 years.
If you’d like more in-depth information on the high-end of the market, just watch the short video below.
Recent Video On Luxury Home Sales
Where Is Tallahassee Moving?
The next graph shows the percentage of home sales that fall in each of Tallahassee’s four quadrants, shown over the years. It allows us to find trends for where people are moving.

NE Tallahassee continues to dominate the home sales in Tallahassee, followed by NW Tallahassee. Combined, the north side of Tallahassee holds 80% of all homes sold this year.
Tallahassee Housing Supply And Demand
The next five graphs show the supply and demand for homes in the Tallahassee housing market, arranged by price range. The first is the overall market, then the subsequent four that follow are organized by each quadrant of Tallahassee.

Tallahassee is in a VERY STRONG sellers’ market for homes priced below $400K and a strong sellers’ market under $550K. We don’t see buyer’s market conditions until we get above that $550K mark.
NE Tallahassee Housing Supply And Demand
The next graph shows the supply and demand for homes in Northeast Tallahassee, arranged by price range.

NE Tallahassee is in a VERY STRONG sellers’ market for homes priced below $550K and a buyers’ market above $550K.
NW Tallahassee Housing Supply And Demand
The next graph shows the supply and demand for homes in Northwest Tallahassee, arranged by price range.

NW Tallahassee is in a VERY STRONG sellers’ market for homes priced below $250K and a sellers’ market under $350K. We don’t see buyer’s market conditions in Northwest Tallahassee until we get near the $400K mark.
SE Tallahassee Housing Supply And Demand
The next graph shows the supply and demand for homes in Southeast Tallahassee, arranged by price range.

SE Tallahassee is in a VERY STRONG sellers’ market for homes priced below $400K, and a seller’s market below $450K, and above $550K. We only see buyer’s market conditions in Southeast Tallahassee for homes priced between $450K and $550K.
SW Tallahassee Housing Supply And Demand
The next graph shows the supply and demand for homes in Southwest Tallahassee, arranged by price range.

SW Tallahassee is in a VERY STRONG sellers’ market for homes priced below $150K, but we immediately see the market transition to a buyer’s market after that.
How Competitive Is Your Price Range?
When it comes time to buy or sell a home, you’ll want to know just how competitive the market will be. One way to tell is by looking at the percentage of active listings already under contract.
A low percentage means that there are not enough buyers for the listings on the market, while a high percentage means the opposite, that there are far more buyers than sellers. In a balanced market, you will typically find about 25% of the homes for sale already under contract with buyers.

In the graph above, the green lines measure the number of listed homes that are already under contract with buyers, while the red lines measure the homes without contracts. Currently, 49% of all listed homes are already under contract, so whether buying or selling, you should know that it is highly competitive out there and you need to be prepared in order to get the best deal possible.
You should also know that there are relatively few homes priced above $600K, so this graph ends up with a lot of volatility at the upper end. For example, if one or two $975K homes dropped prices just below $950K, we would see the $950K price point drop below the normal range.
It’s important at the higher price points that you take a larger sweep of the market to ensure you truly understand how competitive your price point will be.
Percentage Of The Inventory Selling Each Month
I have mentioned that the supply of homes for sale is far too low and the competition for available listings is fierce among buyers. Our next two graphs highlight this point.
This graph shows the percentage of homes sold each month. During normal market conditions, about 17% of the homes sell each month. But look to the right side of the graph, we’re often doubling that amount in recent months.

Each month, a red dot is used to show the percentage of the inventory that sold. If there were no seasonality in real estate, we would expect to see about 1/6th of the homes sell each month (16.7%).
As seasonality is real, we actually expect to see roughly 4 months above 17%, 4 months near 17%, and four months below 17% during the different times of the year. This graph makes it clear, these are not normal times.
When the market was coming out of its collapse, we went more than 8 years without a single month falling within the “normal” range. There were just too many homes on the market and it was common for fewer than 1/10th of them to sell each month.
Now, low inventory levels have the opposite results. About 1 in 3 homes listed for sale sold in each of the past six months. That means when buyers go looking at homes, there is not much out there and the best-priced homes are already under contract with other buyers.
Homes Already Under Contract With Buyers
This next graph shows that more homes for sale in Tallahassee are under contract with buyers than ever before. That means slim pickings for buyers and favorable market conditions for sellers.
Nothing is more frustrating as a buyer than finding the perfect home, only to find out somebody else beat you to it. That’s why I recommend you keep a close eye on the “Coming Soon Website,” so you’ll get an advanced warning before some of the best homes hit the market.

Nearly one-half of all listed homes for sale are already under contract. The green line in the graph above shows that almost 49% of the current listings are already under contract, and the one-year trend of the under-contract percentage is at an all-time high of more than 44%.
Hopefully, we’ll see more sellers enter the market these next few months, and perhaps see a dip in this ratio. But don’t be surprised to see it continue higher if too few sellers arrive.
Housing Supply And Demand Reality
The following two tables make it very easy to do a supply and demand analysis for your specific price range and area of town that you live (or want to live).

Both tables segment the market by quadrant and by price range. The one on the left shows the average number of homes that sell each month, while the one on the right shows the current number of homes for sale.
Let’s start at the bottom right of each table. There are 1,172 homes for sale right now in the Tallahassee housing market, which is 3.5% fewer than the 1,215 we reported last month.
There are 363 selling each month, which is nearly 2% greater than the 357 we reported last month. When we divide sales into the active listings, we can see that 31% are selling each month (which is about 60% higher than normal).
These tables report fewer homes for sale and rising demand from a growing buyer pool.
It is strong evidence for buyers that they need to be ready to go when they are serious about buying a home. While you do not necessarily need to be in a hurry to buy a home, you do need to move with urgency when you find a home you would like to buy.
When it’s time to make a decision on a home, just remember that the market will have brought you to a specific home that you like because of its relative value, so you can be certain the market will be bringing many other buyers to compete with you.
These sellers’ market conditions require buyers to make prompt decisions and move aggressively when the right home is found.
Speak To A Local Expert!
 Joe was born and raised in Tallahassee and has been selling real estate for over 30 years.
Let us show you how to use our local knowledge of Tallahassee and the current state of the housing market to your advantage, ensuring you the best deal possible when selling or buying a home.
His past customers speak volumes (you will see Joe's past-customer reviews after you submit the form) on why you should hire Joe to be your real estate agent.
Talk to us today about helping you negotiate a better deal, with better terms, when selling or buying your home. You'll be glad you did!
Real Estate Seasonality
As stated earlier, there are seasonal changes that influence the housing market. This next graph identifies the percentage of listed homes that sold each month for the five-year period of 2015-2019.
Think of this as what “should” happen during normal times, with “normal” being defined as the past five years.

As you can see, we have now started what would traditionally be the slower six months of the year, from September through February.
What’s really interesting is that inventory levels have been so low over the past few years that only January is averaging fewer than 1/6th of the inventory selling. To put this into perspective, only 6% of listings sold in January of 2013 and just 7% in January of 2014. Last year, more than 14% of the listings in January sold.
So what this means is that the time of year is really not significant if you want to sell your home. Right now, buyer demand is high, inventory is low, and we’re going to be blowing up historical seasonal numbers.
Right now, there is both pent-up demand from buyers who have yet been able to secure a home in this uber-competitive market, as well as pent-up supply from sellers who were waiting for the pandemic to pass.
Many of these hesitant sellers have seen their friends and family members move safely to a new home and take advantage of the historically low mortgage interest rates. I expect to see new inventory come in during the final quarter of 2020 at a higher rate than we would normally see.
Mortgage Interest Rates Motivating Buyers
The final graph and tables in today’s housing market report is the catalyst of the fire that has been lit under buyers. It is bringing them en masse to the market despite the pandemic occurring all around the world.

The mortgage graph shows nearly 50 years of monthly mortgage interest rates. We’ve seen them as high as 18.45% and as low as 2.83% (the current rate). Over the past fifty years, the average rate has come down to 7.91%, a full 5% higher than today’s rate!
We saw a new record-low mortgage interest rate recorded in August and then again in September, and yet again in October. Here is what it means to homebuyers today.
It’s probably more significant than you might imagine (After all, what’s a few percentage points anyway?).
How Low Mortgage Rates Impact Home Affordability
The tables shown here allow us to do two separate studies of the impact of low mortgage interest rates. First, we show the monthly savings a buyer is getting today versus rates we’ve seen in the recent past, while the second shows how buying power will fall when mortgage interest rates begin to return to normal.

The table on the left was built to show a $300,000 loan and the impact of changing mortgage interest rates on that borrower’s monthly payment.
If rates were to move up one full percent (to a still-very-low rate of 3.83%), that buyer’s payment would go up 13%. When rates return to the fifty-year average, that buyer’s payment would be about 75% higher each month!
This is not a small deal to most people that I know. What monthly payment do you have that you wouldn’t care about a 75% increase? That’s why these rates are so outrageously good today.
I think a better way to understand changing interest rates though can be found in the table on the right. My experience selling homes in Tallahassee for the past 30 years has taught me that most buyers purchase as much home as they can get based upon what they can borrow.
So instead of seeing monthly mortgage payments rise, we’ll see the borrower’s loan amount drop (to keep the payment the same). So a buyer who can borrow $300K today will only be able to borrow $265K when interest rates rise 1%.
If the buyer waits until rates return to the fifty-year average, then the buyer will be able to borrow just $170K! That means the buyer who waits until normal rates return will see his buying power reduced 43%.
This buying power, strengthened by today’s low mortgage interest rates, is the primary reason demand has remained so strong during the pandemic. Had there been no COVID-19, we wouldn’t have seen rates drop so low.
These temporarily low rates are part of the government’s stimulus to help restore the economy. The stimulus only helps you if you use it. If you do not want to move, you should still talk to a lender about refinancing any homes that you own. Conversations are free and the resulting refinancing that many will enjoy will end up saving a lot of money on each loan repayment.
If you have been holding off selling, then it likely means that you’ve been holding off buying too. If you are strong enough to pay cash, then this is not necessarily a big deal. But if you plan to finance your next home, you should strongly consider getting your home sold and getting into the next one with today’s cheap money.
Housing Market Report Information
I hope our November 2020 Housing Market Report has given you insight into today’s conditions. Do you have any questions you’d like answered in this or other housing market reports? If so, you can leave a comment below or give us a call anytime!
