 Recently, I was discussing the sustainability of today’s pace of home sales with a friend and it gave me the idea to dust off some old data in order to find an answer to this important conversation.
The housing market is hot, but is it too hot? Can we keep selling homes at the rates we’re seeing today, or is this a case of what goes up, must come down?
I’ll do my best to answer these questions in today’s housing market report.
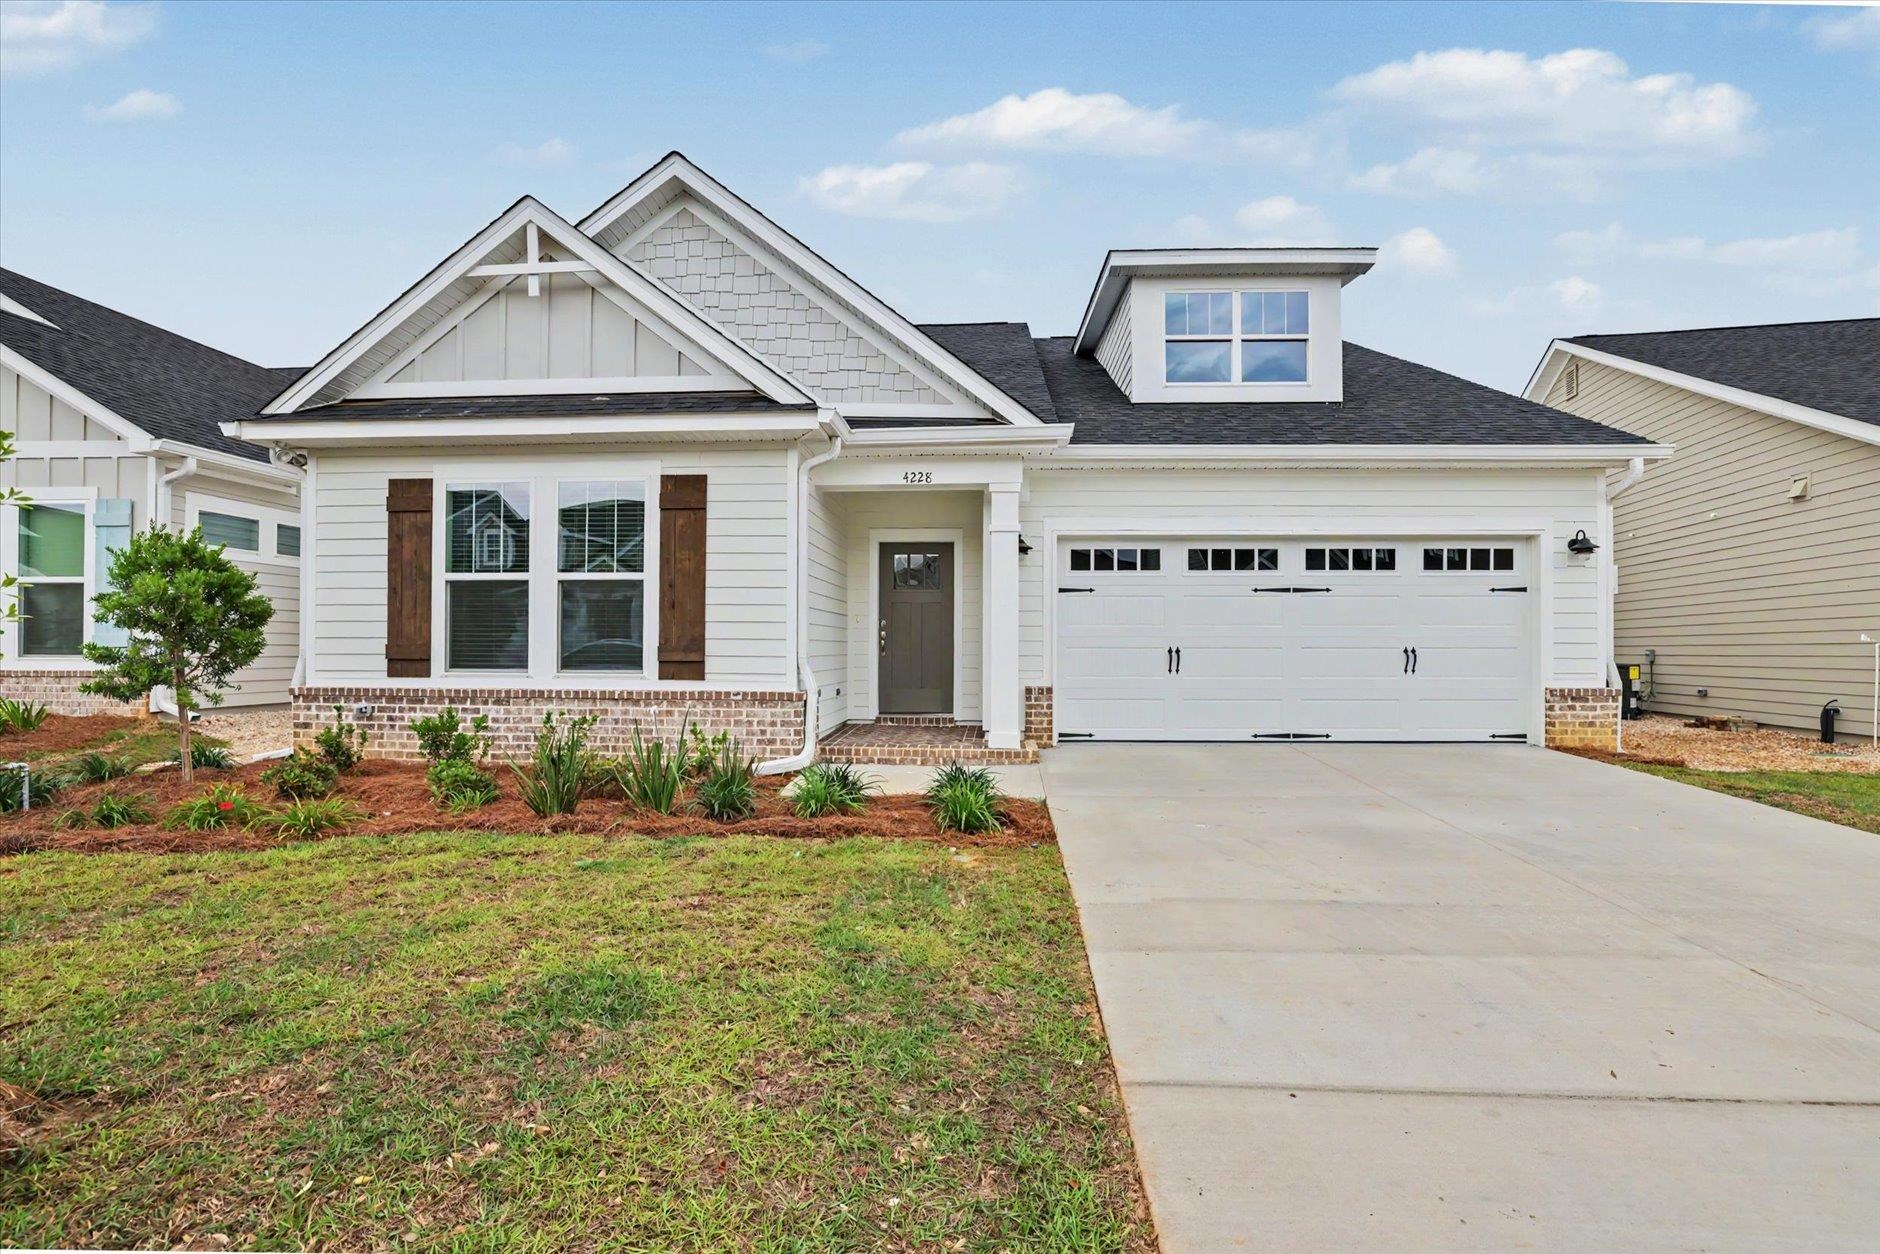
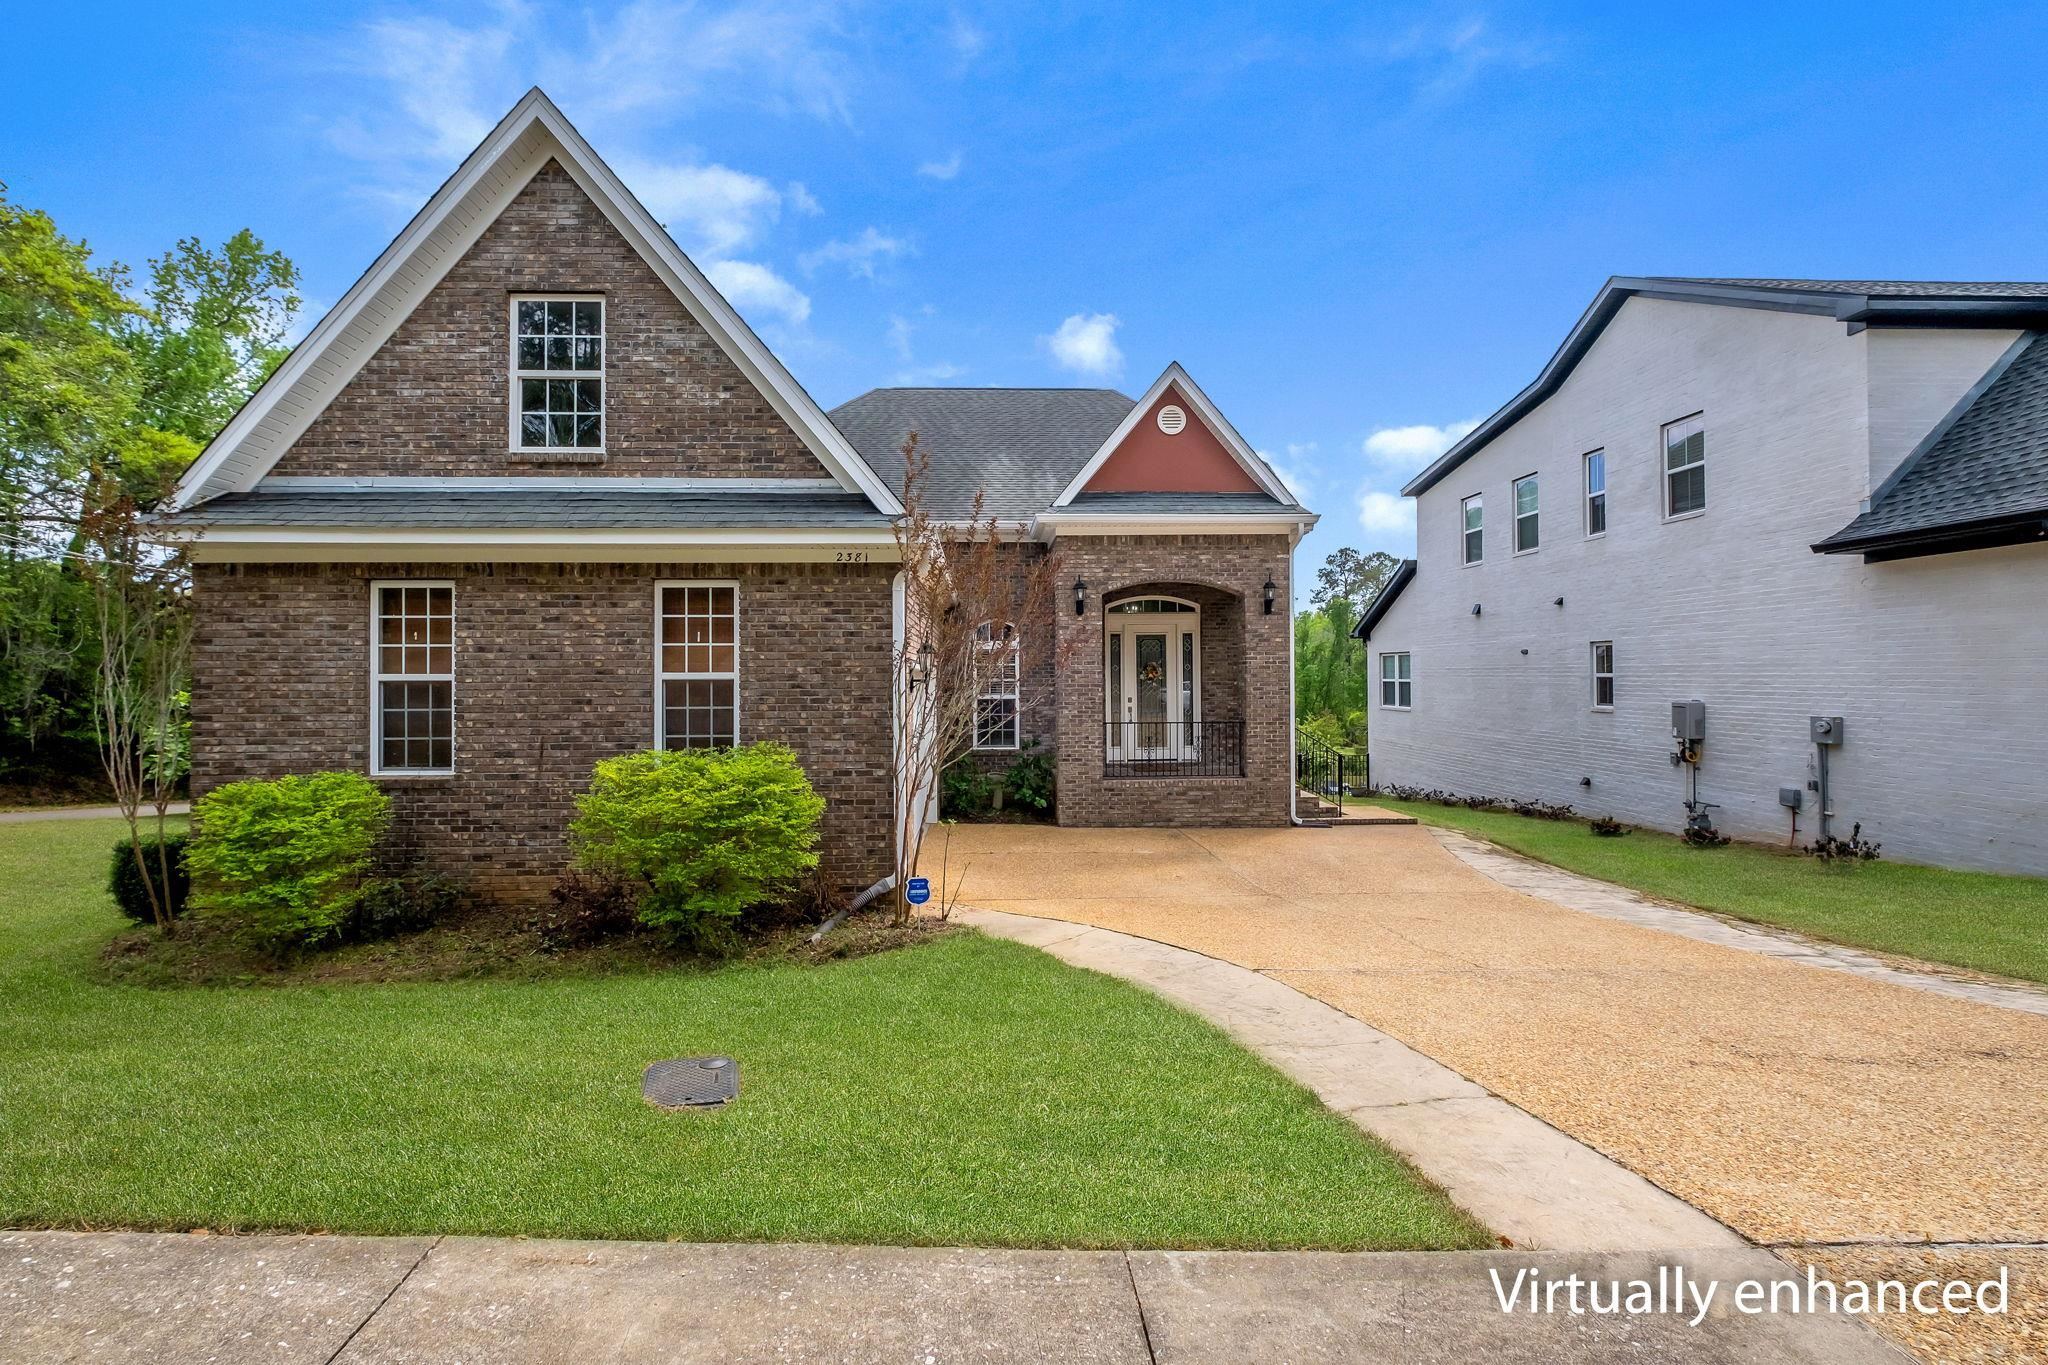
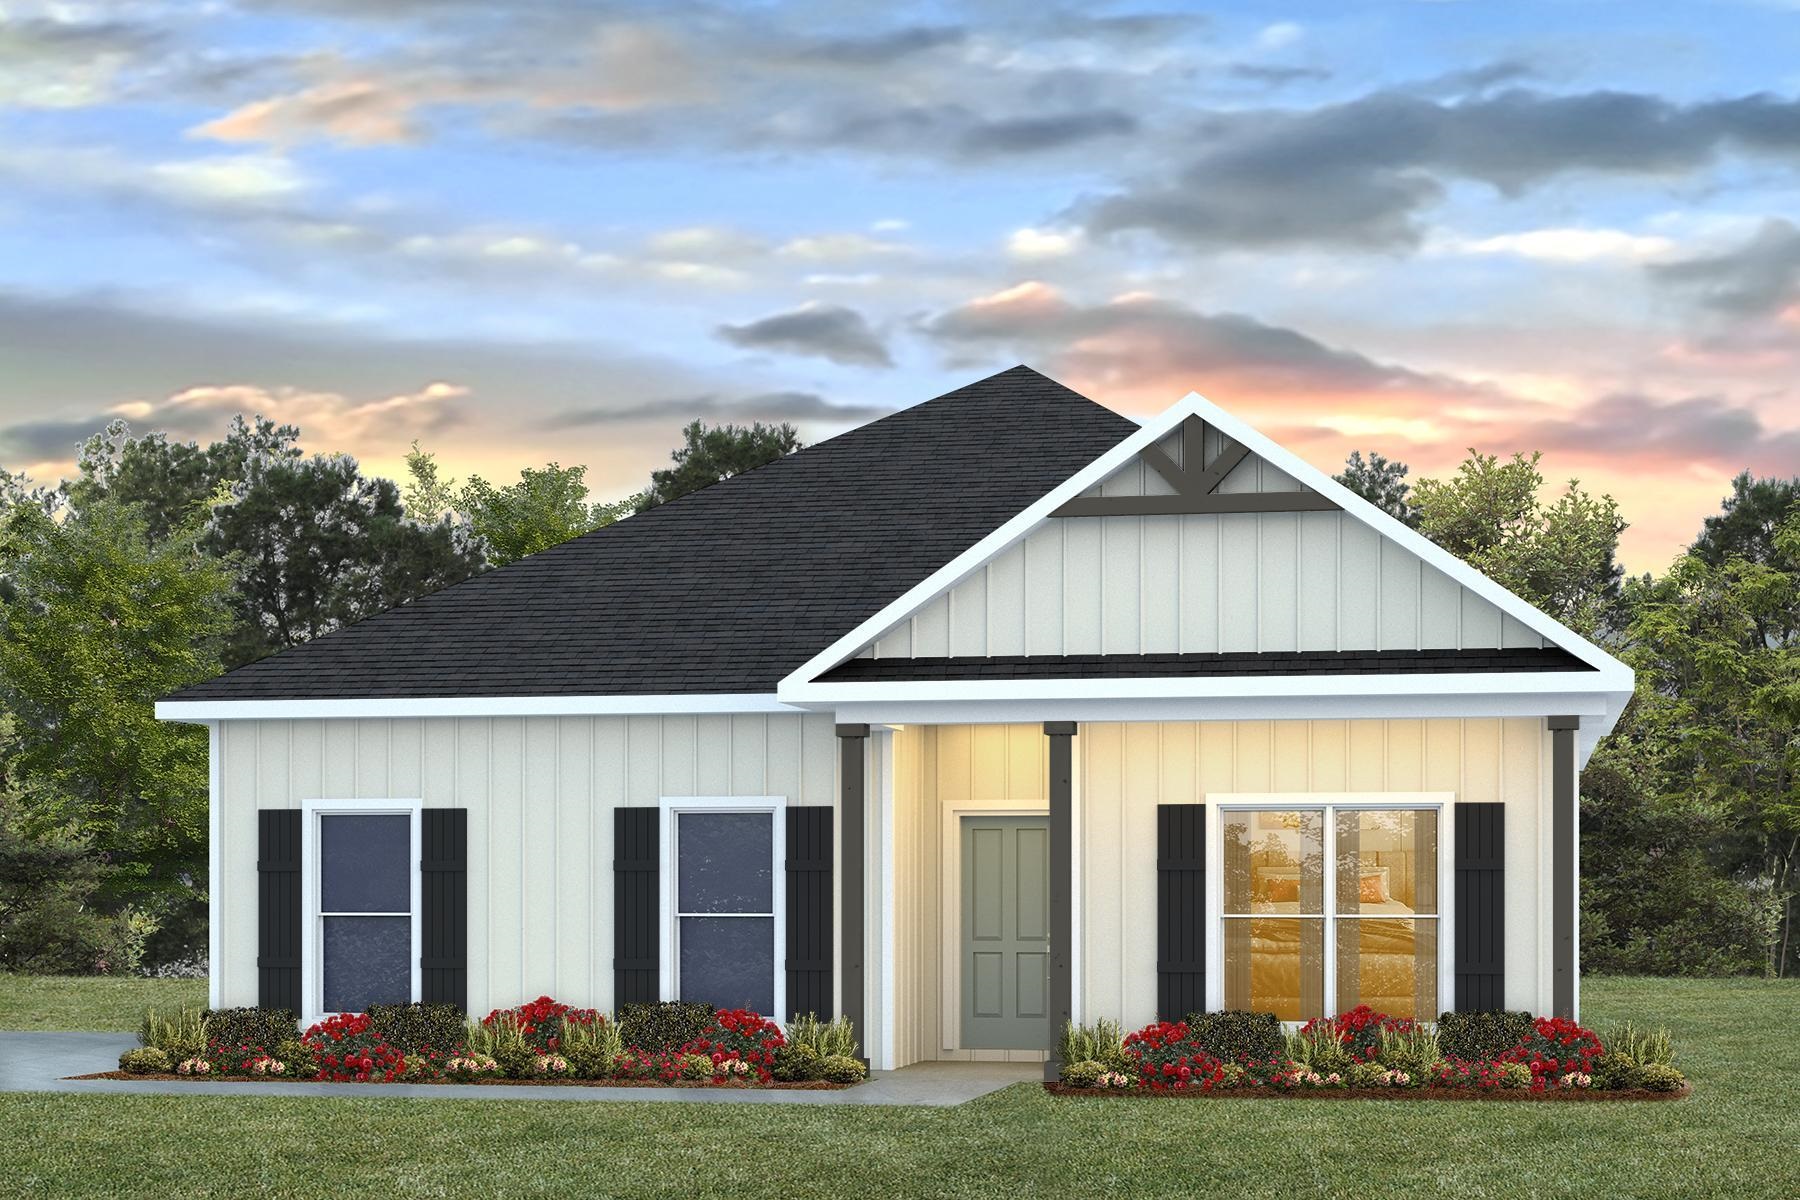
Let’s start by looking at the current listings available in the Tallahassee real estate market. What should jump out at you as you scroll through these homes is that a bunch of the ones priced below $600K are already under contract with buyers!
Tallahassee Homes For Sale
Tallahassee Homes for Sale


VIDEO: Home Sales Sustainability
Just a quick note on my sources of information for this report. Normally, the charts and graphs that I share are produced from information taken from the Tallahassee Board of Realtors Multiple Listing Service (MLS), but all but the last two graphs were produced from information purchased from Metro Market Trends.

The MLS does not contain all the sales in our area. Right now, about 81% of all home sales are reported by the MLS, so a more accurate view of the entire market is through data that comes from the Leon County Property Tax Appraiser. This is the source of the data that I use.
The graph above shows all home sales plotted in red, while the Tallahassee Board Of Realtors logo area reveals the number of home sales contained in the Realtor MLS.
I favor using the MLS in most reports, as it is available far sooner than the date upon which the County can deliver. But when I really want to know information on all home sales, I have to look beyond the MLS.
How Sustainable Is Today’s Pace Of Home Sales?
I believe the best way to evaluate the sustainability of the current pace of home sales is to look at the past. Our first graph starts with a view of existing home sales.

There is a blue diamond posted for the number of existing homes sold each month going all the way back to January 1991. The red line plots the linear trend of monthly sales.
The linear trend shows that there is a general increase in the number of existing homes sold each month, though recent numbers are nowhere near the level we saw in the years prior to the housing bubble. But there is more to the market than just existing home sales.
New Home Sales Trending Lower
Unlike existing home sales, new home sales are trending lower, at a significantly faster rate.

The linear trend here shows a decline of nearly 70% from 1991 to today, and there does not seem to be an effort from builders to grow. While we might be able to blame today’s fewer new construction sales on the impact of the pandemic, the reality is that new home sales should have escalated back in 2016 when market equilibrium was reached.
Declining Overall Trend In Home Sales
The fourth graph in today’s report puts the data from each of the past two graphs together and generates the 30-year trend for home sales in Tallahassee.

I found it surprising that the overall trend for the past 30 years was declining, but that is indeed the case. One would expect a decline if the population was declining or if jobs and economic growth were receding, but our next graph negates the issue of population growth.
Population Growth Yet Declining Home Sales
This graph plots annual home sales in blue against annual population totals (filled background).

Tallahassee’s annual population has grown at an average rate of 1.38% from 1991 through the present time, which means there are an additional 50% more people in Tallahassee today than there were in 1991.
One would think that there would be a parallel increase in the overall housing market, but that has obviously not occurred. In fact, the linear trend of home sales is declining. To be clear, our population is growing, and yet the number of homes selling each year is on the decline!
One explanation could be that the 1990s enjoyed a robust housing market, and if our data went back further, we might see significantly lower sales figures. Unfortunately, I do not have that data!
Our next graph will look at long-term trends and cycles to see what “the numbers” say about the sustainability of home sales in Tallahassee.

Your Agent Matters!
74% of homebuyers work with the first agent they speak to, so they typically don't understand that it is in their best interest to first interview a qualified buyer's agent before they commence with the rest of the home search and home buying process. But they learn.
They learn when they ...
- lose out on the perfect house
- pay excess third-party fees during the transaction
- over-spend for a home that they could have bought at a lower price
- the home is not the best fit for what they need
So join the 26% of homebuyers who are smart enough to put themselves first. Here's how to do it.
Long-Term Home Sales Trends
This next graph plots monthly home sales and then computes the one-year, 8-year, and 16-year trends in order

The red line in the chart above plots the one-year trend of home sales. This means that every point on the chart represents the average number of homes sold each month for the past year. Similarly, the blue line plots the average number of homes sold each month over the past eight years, while the gray line plots the average number of homes sold each month over the past sixteen years.
While I am not a true math geek (readers who are, please chime in down in the comments section below), I think this chart shows a lot of upside potential. The one-year average is above both the longer-term trends. The middle trend at eight years just crossed over the long-term trend and (I believe) suggests that we’ll see about seven to eight more years of the growth trend in the eight-year average.
Again, this is not my specialty, but I do believe that the combination of recent years’ home sales activity with a growing population favors a growing housing market. Sure, there are many short-term factors that could derail this (rapidly rising mortgage interest rates, lost jobs, struggling economy, etc.), but I think history supports the expected growth in housing.
The Fly In The Ointment
While history favors a growing housing market, I do believe the biggest issue that we’ll need to overcome is affordability.

This graph plots the average price per square foot of homes sold each month in Tallahassee over the past thirty years. The blue line plots the one-year average (which just moved to an all-time high), while the thin black line measures the eight-year average.
The yellow line was added manually and is not “scientific,” but I use it to take the average from the 1990s and extend it forward. During the housing market recovery, we saw home values drop below this average, but since 2018, homes have appreciated in value to levels above this growth rate.
Unfortunately, we do not have data prior to the 1990s, so we have no idea how “normal” the appreciation rate was during that decade. I’ve used this graph for years though to estimate the number of people who were upside-down in their homes due to the bursting of the housing bubble back in 2006. I am happy to report, that number is now down to zero.
The eight-year trend line provides an interesting insight. We saw it rise from as early as the mid-1990s through sometime in 2010 (so at least 15 years), though it went through about 8 years of decline before reversing to positive about 3 years ago. So what does this mean?
The short answer is I’m not really sure, though I’m betting on at least five more years of value growth before we see any real sign of a negative movement. Of course, when you factor in the many measurements and statistics that I’ve shared in recent reports that specifically relate to the supply and demand for homes, everything in the market points to values rising at faster-than-normal rates for the foreseeable future.
Top Tips For Home Sellers


How To Sell Your House On Your Own

10 PROVEN Strategies To Increase A Home's Selling Profit
2025s HOTTEST Home Selling Strategies You Need NOW
The 3-DAY Method To Sell Your Home For More (2025)

The Best Time To Lower The Price In A Home Sale

How FOMO Makes Your Home Sale More Profitable

Home Sale Sabotage: Top 10 Mistakes Sellers Make
What Will Future Reports Reveal?
The final two graphs in today’s report come from data pulled from the Tallahassee MLS. This allows me to assess the market nearly a full month earlier than I can by relying on data from the property tax appraiser’s office.

Home sales in the MLS rose about 10% in March when compared to March of 2020. There might still be some real estate agents posting sales late, so we can expect a slightly higher number of homes sold in March when all have been reported.
The housing market is on a very strong run right now. For the past seven months (and eight of the past nine), the MLS has posted year-over-year gains. Considering how sales fell off when COVID hit last year, it won’t surprise me to see three more months of gains in our near future.
Year To Date Home Sales Rise 11%
While the previous graph measured year-over-year home sales, this graph measures home sales year-to-date, thus each year is showing the number of homes sold in the first quarter.

Home sales in 2021 trail only 2005 and 2006 for the number of homes sold in the first quarter of the year. Though this graph only goes back to 2002, I will tell you that this means 2021 has started out as the third strongest year ever in Tallahassee.
And therein lies the question that we have attempted to understand in this report. Is this level of home sales sustainable?
Based on what we have examined today, I do believe so. All but two factors appear to support continued growth in the housing market, and those two (rising mortgage interest rates and declining home affordability) have not shown themselves to be show stoppers yet.
But that’s why we monitor everything so closely. We’ll let you know when the first signs of a slow-down begin. We’ll see the relative supply of homes begin to rise, and then we’ll see the real supply follow suit. The housing market does not change overnight, so we’ll all have advanced notice of what’s to come.
Top Tips For Home Buyers

Buy Now Or Wait? The 91.6% Rule

Biased Results? The New York Times Rent Or Buy Calculator

Do's And Don'ts During The Home Loan Process

6 Real Estate Contract Terms You Should Not Overlook

7 Tips On Buying A Home With A Pool
How much house can you actually afford (By Income)?

What Does "Marry The House Date The Rate" Mean In Real Estate?

Why Fixer Uppers Are the New Gold | Home Renovation Guide

8 Tips For Buying An Affordable Florida Vacation Home
When moving to, in, or from Tallahassee, you will fare better if you work with a local expert. We are here to help. If you have further questions on the Tallahassee real estate market, you can leave a comment below, give us a call at (850) 366-8917, or drop us a note and we'll give you the local information needed to ensure a successful, smooth transaction.
As a local born and raised in Tallahassee with a focus on customer service, I promise you'll find great success when working with Joe Manausa Real Estate, just as have our past customers. You can read thousands of their reviews reported on Google, Facebook and Zillow right here: Real Estate Agent Reviews Tallahassee.
 Have you heard about my new book "The Business of Getting Business?" It's a comprehensive guide for small businesses to help them make the move to digital. For those of us who want to survive and thrive in a world where large corporations are taking over, it is a must-read. It's also the perfect guide for how to sell a home in the digital age. You can find The Business Of Getting Business by clicking on any of the trusted retailers below.

Think all REALTORS are alike?
Read what people are saying about working with Joe Manausa Real Estate! You can see thousands of real customer reviews reported on Google, Facebook and Zillow at this link: CLICK HERE FOR REAL ESTATE AGENT REVIEWS.

