Tallahassee Housing Market Slowdown: Homes Taking Longer To Sell

Posted by
Share
Share
Share
Share

Summary

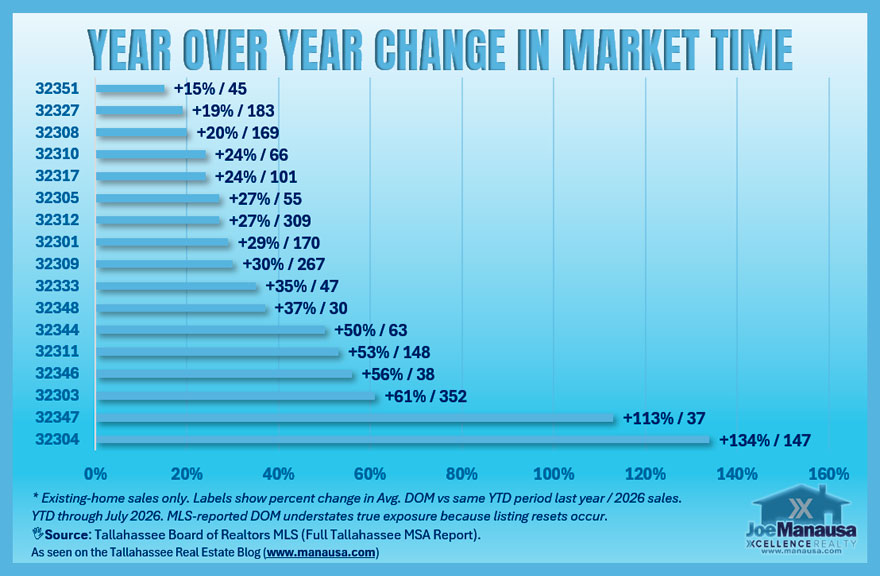
Tallahassee housing market slowdown data shows that homes are taking longer to sell, but the slowdown is not affecting every location or price range equally. Leon County existing-home sales averaged 94 reported days on market through July 2026, while reported market time was 42% higher than during the comparable period last year. At the ZIP-code level, year-over-year increases range from 15% in 32351 to 134% in 32304 among the areas shown.

The change is also visible in how long individual sales take. In many Tallahassee ZIP codes, half or more of 2026 sales required more than 60 days to close from listing, while the long-term market-time mix shows a sharp reduction in homes selling within 30 days.

This is a slowdown, not evidence that every part of Tallahassee has become a buyer’s market. Current months of supply varies substantially by ZIP code and price range, which means sellers need to price for their specific competitive set and buyers need to understand that leverage can change dramatically from one property to another.

For continuing Tallahassee real estate analysis, the most useful question is no longer simply whether the market has slowed. The important question is where the slowdown is strongest and what that means for your next move.

Key Takeaways

  • Leon County market time is rising. Existing-home sales averaged 94 reported days on market through July, and the year-over-year county comparison shows a 42% increase.
  • Fast sales are becoming less dominant. The share of homes selling within 30 days has dropped sharply from its 2021-2022 peak.
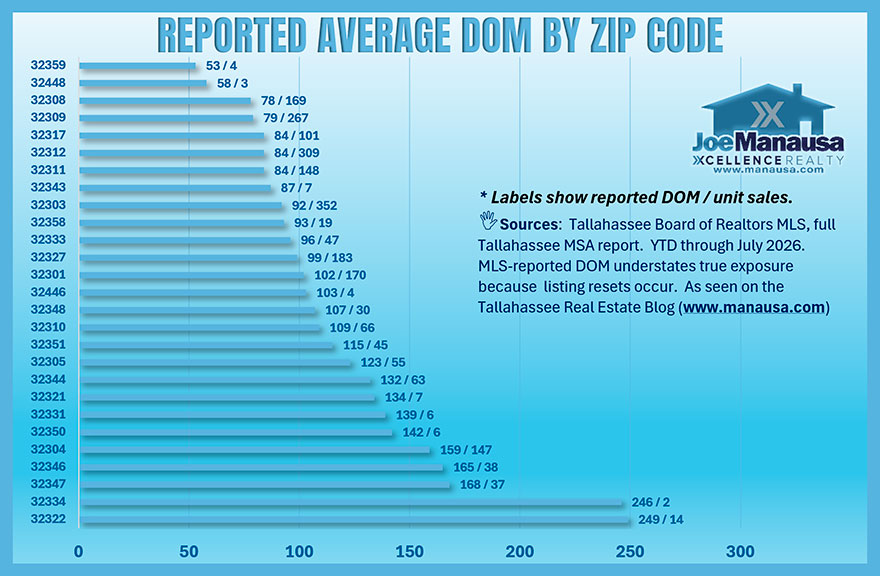
  • The Tallahassee housing market slowdown varies widely by ZIP code. Reported average DOM ranges from 53 days in 32359 to much higher levels in several ZIP codes, although very small samples require caution.
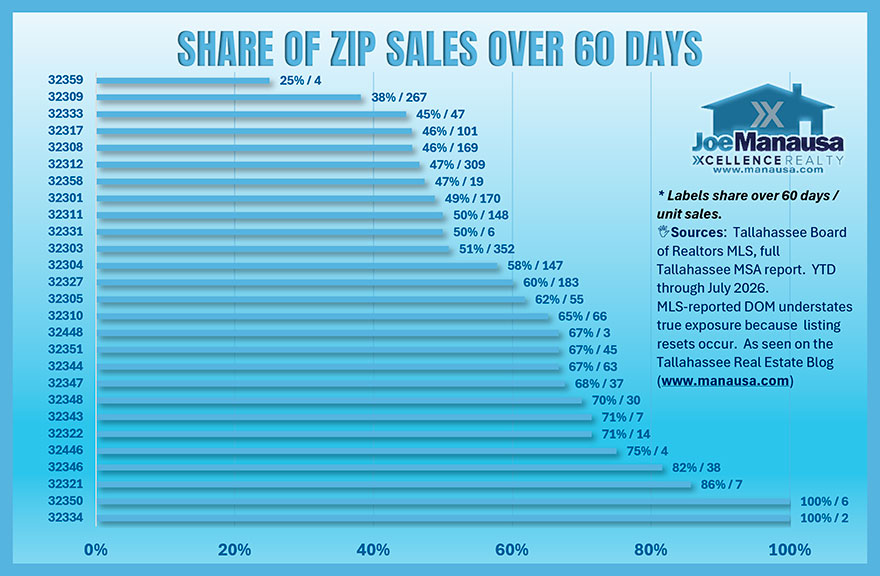
  • More homes are crossing the 60-day mark. At least half of sales took more than 60 days in many ZIP codes shown in the report.
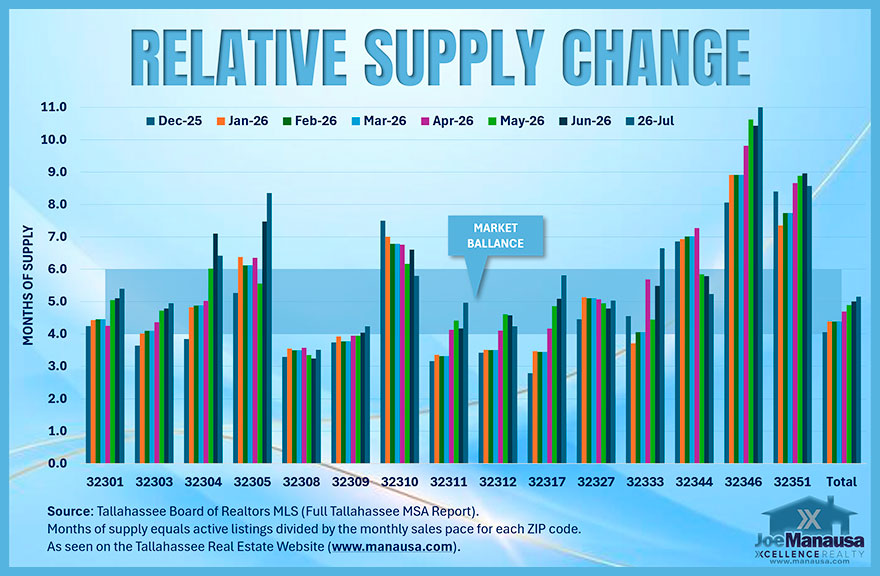
  • Supply is uneven. The overall market is near 5.0 months of supply, but individual ZIP codes range from roughly three months to more than ten months.
  • Price still matters. Market time has risen across price tiers, but the pattern is not identical at every price point.
  • Reported DOM is not true market exposure. MLS-reported market time is structurally biased downward when listings are withdrawn, canceled, and relisted because the reset can remove prior exposure from the reported DOM.

Tallahassee’s Fast-Sale Era Is Reversing

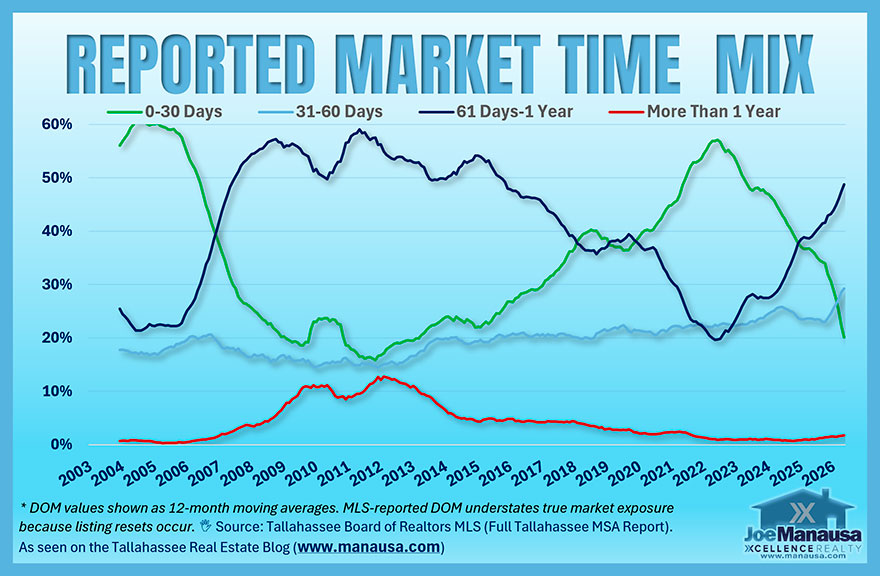
The best place to understand today’s Tallahassee housing market slowdown is the long-term market-time mix. Rather than looking only at one average, this graph shows what share of sales occurred within 30 days, 31 to 60 days, 61 days to one year, or more than one year.

Tallahassee housing market slowdown showing the changing share of homes sold within 30 days, 31 to 60 days, and more than 60 days

The short-term change is significant. The green 0-to-30-day line surged during the unusually fast 2021 and 2022 market, when more than half of sales were occurring within a month. By the latest reading, that share has fallen to roughly one-fifth.

At the same time, the 61-days-to-one-year category has climbed sharply and again represents the largest portion of reported sales. The 31-to-60-day share has also moved higher.

That does not mean Tallahassee has returned to the conditions seen after the housing crash. The more-than-one-year category remains very small compared with its 2011-2013 levels. The current story is better described as a normalization toward longer marketing periods, not a return to distressed-era conditions.

National measures can provide useful context, but they should not replace local evidence. The National Association of REALTORS housing statistics and its REALTORS Confidence Index track broader sales and market-time conditions, while the graphs here measure our local MLS market.

Keep Up With New Trends In Tallahassee!

Get The Tallahassee Real Estate Newsletter
Subscribe to the Tallahassee Real Estate Newsletter for updates on home sales in Tallahassee, FloridaDon't be the one that doesn't know what's going on when you sell a home or buy a home in Tallahassee.

Other buyers, sellers, lenders, and real estate agents have this critical information, and now you can too!

Get immediate access to our most recent newsletter.

Let more than 30 years of experience work for you with charts, graphs, and analysis of the Tallahassee housing market.
The Slowdown Is Showing Up Across North Florida

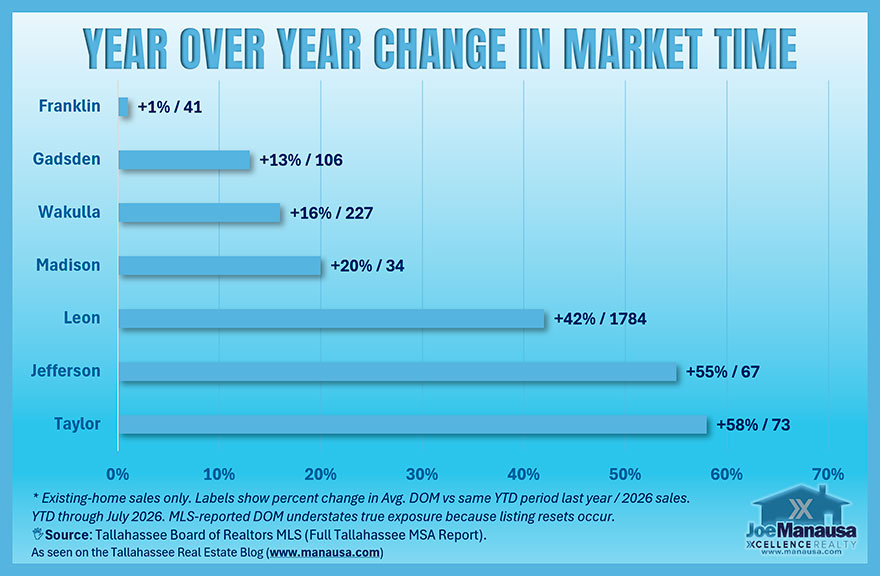
The next graph compares 2026 reported average market time with the same year-to-date period in 2025 for existing-home sales by county.

Tallahassee area housing market slowdown with year-over-year increases in reported market time across North Florida counties

Every county shown posted a year-over-year increase. Leon County, by far the largest sample at 1,784 sales, recorded a 42% increase. Gadsden rose 13%, Wakulla 16%, Madison 20%, Jefferson 55%, Taylor 58%, and Franklin 1%.

The smaller counties require more caution. Franklin had only 41 sales, Madison 34, Jefferson 67, and Taylor 73. Leon’s much larger sample makes its 42% increase especially important to the Tallahassee housing market slowdown.

For broader statewide comparison, Florida Realtors publishes Florida housing market reports, including state and regional statistics.

How Long Are Homes Taking To Sell By County?

Year-over-year change tells us direction. The next graph shows the actual reported average market time.

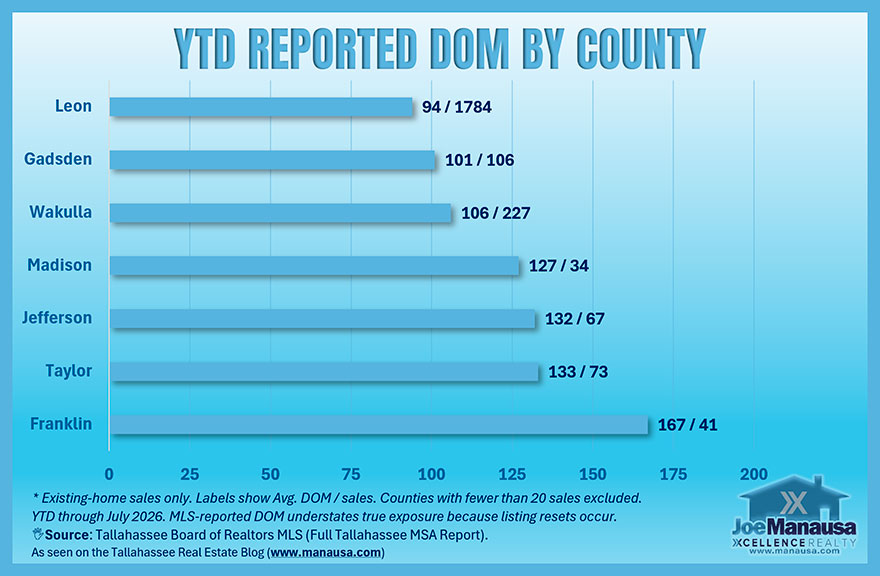
eported days on market by county for existing-home sales in the Tallahassee area through July 2026

Leon County had the lowest reported average among the counties shown at 94 days, followed by Gadsden at 101 and Wakulla at 106. Madison averaged 127 days, Jefferson 132, Taylor 133, and Franklin 167.

That comparison illustrates why percentage changes alone can mislead. Franklin’s year-over-year increase was only 1%, yet its actual reported market time remained the longest of the counties shown. Leon’s 42% increase sounds much worse, but its absolute reported DOM remained lower.

Buyers considering communities beyond Leon County should therefore evaluate both the direction of change and the actual marketing time. Our Tallahassee communities and neighborhood guides can help compare locations before narrowing a search.

Hire a Qualfied Buyer's Aent

Speak To An Expert!

Joe has created a process that was designed to save you money on the purchase of a new home.

His past customers speak volumes (you will see Joe's buyer reviews after you submit the form) on why you should have Joe be your buyer's agent.

Talk to us today about helping you negotiate a better deal, with better terms, when buying your new home. You'll be glad you did!

Some Tallahassee ZIP Codes Are Slowing Much Faster

The Tallahassee housing market slowdown looks very different from one ZIP code to another, and county averages conceal those differences. ZIP-level year-over-year data makes that clear.

Tallahassee housing market slowdown by ZIP code showing year-over-year increases in reported days on market

Among the higher-volume ZIP codes, the differences are substantial. Reported market time rose 20% in 32308, 27% in 32312, 29% in 32301, 30% in 32309, 53% in 32311, 61% in 32303, and 134% in 32304.

The graph also shows a 113% increase in 32347, but that figure comes from only 37 sales. Small samples can create dramatic percentage movements, so the sales count beside each bar matters.

For buyers, this variation is a reminder that a broad statement about the Tallahassee market cannot tell you how much competition exists around a specific property. Buyers can use the Tallahassee home finder and newly listed Tallahassee homes to watch their actual competitive set rather than assuming every ZIP behaves alike.

Reported Average DOM Varies Dramatically By ZIP Code

The next graph moves from year-over-year change to actual reported average market time.

allahassee average days on market by ZIP code showing large differences in home-selling time during 2026

Several high-volume ZIP codes remain well below the slowest parts of the market. The graph shows 32308 at 78 days across 169 sales, 32309 at 79 days across 267, 32312 at 84 days across 309, and 32303 at 92 days across 352.

At the slower end among ZIP codes with meaningful sales volume, 32304 averaged 159 days across 147 sales, 32346 averaged 165 across 38, and 32347 averaged 168 across 37.

The apparent extremes require caution. For example, 32334 shows 246 days but only two sales. A two-sale average should never carry the same analytical weight as 32303’s 352-sale average.

Sellers should therefore resist pricing from a countywide average. Start with the homes that actually compete with yours. A current Tallahassee home value evaluation and a disciplined home-selling strategy become more important when market time is expanding.

More Sales Are Taking Longer Than 60 Days

Another way to measure the Tallahassee housing market slowdown is to look beyond average DOM and examine how many sales take more than 60 days. Looking at the share of sales requiring more than 60 days provides another way to measure the slowdown.

Tallahassee homes taking more than 60 days to sell by ZIP code during the 2026 housing market slowdown

The pattern is broad. The graph shows more than half of sales exceeding 60 days in 32303, 32304, 32305, 32310, 32327, 32344, 32346, 32347, 32348, and 32351, among several others.

Even some of Tallahassee’s largest sales areas have substantial slow-sale shares. In 32303, 51% of 352 sales exceeded 60 days. In 32327, the figure was 60% of 183 sales. In 32312, 47% of 309 sales crossed 60 days.

Meanwhile, 32309 stands out on the faster side: 38% of its 267 sales exceeded 60 days.

This matters to sellers because longer exposure increases the cost of a weak launch. If you are preparing to sell, the home-selling guide and broader Tallahassee seller resources explain the planning decisions that become more important when buyers have time to compare alternatives.

Why Most Luxury Real Estate Marketing Plans Don't Work

Realtor at work in TallahasseeBecause most real estate agents don't work a plan!

Face it, most real estate agents are using the same method to attempt to sell luxury homes. They promise you the moon and stars in order to get you signed up, and then .... nothing.

  • Sign In Yard
  • Entered In MLS
  • Lockbox On Door
  • Mass eMailed To Agents

And that's about it!

Nearly 1/2 of all luxury home sellers end up hiring a second company (and 20% hire more than 2). Why? Because they failed to vet their first agent before they signed a listing agreement. These sellers end up leaving a ton of money on the table, and they sell their home in YEARS, not days or months!

You can do better than this! Why not take a moment to tell us how to reach you to set up a "no strings attached" initial consultation? We can prepare you for receiving TOP DOLLAR for your luxury home in a reasonable amount of time. It doesn't take years to sell a luxury home, it just takes the right marketing plan and an agent wiliing to do the work.

Supply Explains Why Some Areas Feel Different

Market time and inventory should be evaluated together. The next graph shows how months of supply has changed across Tallahassee ZIP codes from December 2025 through July 2026.

Tallahassee housing supply by ZIP code showing months of supply relative to buyer demand through July 2026

Overall supply finished near 5.0 months, up slightly from 4.9 the previous month. That aggregate, however, hides large geographic differences.

The latest readings shown are about 3.2 months in 32308, 4.0 in 32309, 4.2 in 32311, 4.6 in 32312, and 4.8 in both 32303 and 32327. At the other end, 32346 is shown at 10.4 months and 32351 at 9.0 months.

This is why “the Tallahassee market” can feel fast to one buyer and slow to another. Inventory relative to sales pace changes with location, property type, condition, and price.

For broader context, the U.S. Census Bureau Building Permits Survey tracks new residential construction at national, state, metro, county, and local levels, while FHFA house-price data provides another independent view of housing-market changes.

Get Our Free Market Update

Weekly Special real estate report covers the Tallahassee real estate market

Other buyers, sellers, lenders, and real estate agents have this critical information, and now you can too!

Get immediate access to our most recent newsletter.

Let more than 30 years of experience work for you with charts, graphs, and analysis of the Tallahassee housing market.

Each Monday morning we send out a simple, one-page report that provides a snapshot of the Tallahassee housing market. It only takes 2 minutes to read, but it gives you better market intelligence than most real estate agents possess. Just tell us where to send it below!
The Price Range Changes The Supply Picture

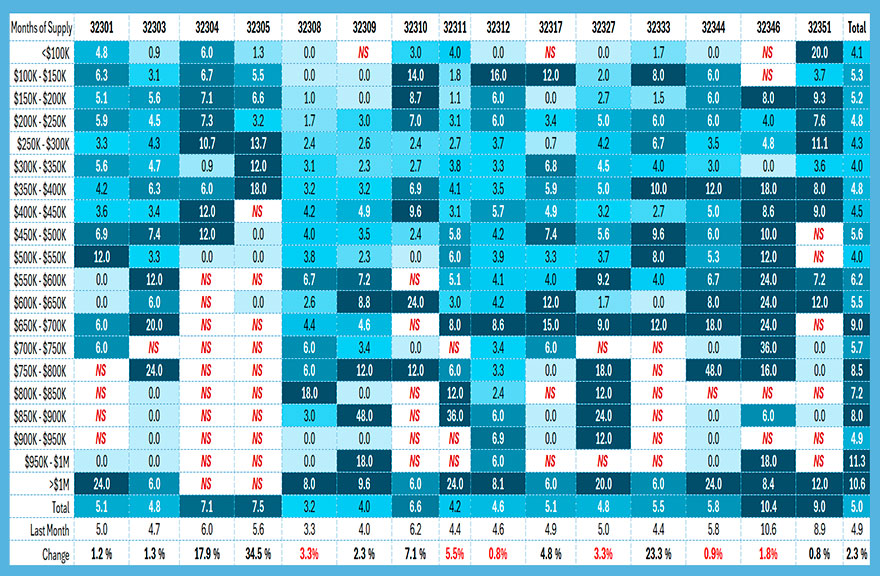
The detailed months-of-supply table adds price segmentation to the ZIP-code analysis.

Tallahassee months of housing supply by ZIP code and price range showing uneven buyer and seller conditions

The total column sits near 5.0 months of supply, but individual cells range from no sales in some thin segments to double-digit supply in others.

That dispersion is more useful than the marketwide average when making a real decision. A seller competing in a three-month-supply segment faces a different environment than one competing in a ten-month-supply segment. Likewise, buyers who feel they have little negotiating room in one price range may encounter substantially more choice in another.

Consumers should not interpret an NS cell as a market verdict. It means the segment lacks a sale from which to calculate a meaningful sales pace.

Buyers trying to set a realistic price ceiling can pair current inventory with the Manausa affordability calculator and mortgage calculator. Mortgage costs remain an important part of purchasing power. Freddie Mac’s current Primary Mortgage Market Survey and the Federal Reserve Bank of St. Louis 30-year mortgage-rate series provide authoritative national rate benchmarks.

Market Time Is Rising Across Price Tiers

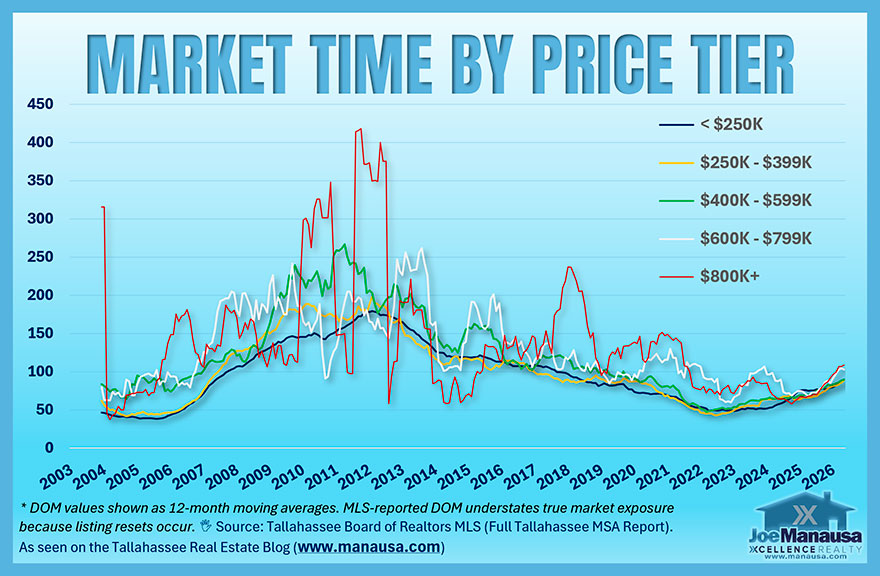
The final long-term graph separates reported market time by price range.

Tallahassee market time by home price tier showing longer selling times across the 2026 housing market

The long-term pattern provides valuable perspective. Market time rose dramatically around and after the housing crash, then generally declined for years before reaching unusually low levels during the pandemic-era market.

The latest movement is upward across the price tiers shown. That supports the broader Tallahassee housing market slowdown signal seen in the ZIP-code, county, and 60-day-sales graphs.

It does not support the claim that every price range is equally weak. The lines remain separated, and higher-price tiers can also be more volatile because they contain fewer transactions.

Buyers shopping at the upper end should compare the actual inventory they are considering rather than generalizing from the marketwide average. Current Tallahassee luxury homes provide one way to see that active competitive set. First-time purchasers can instead begin with our first-time home buyer resources.

What The Tallahassee Housing Market Slowdown Means For Sellers

A slower market punishes optimistic pricing more quickly than a fast market does.

When buyers have more alternatives and more time to evaluate them, an overpriced home can accumulate market time while competing listings sell. The solution is not automatically to slash the price. It is to identify the correct competitive segment before launch and make sure condition, positioning, presentation, and pricing agree.

Three numbers deserve attention:

  1. Reported market time for comparable homes.
  2. Months of supply in the property’s location and price range.
  3. The share of comparable sales taking more than 60 days.

Sellers should also remember that reported MLS DOM can understate true exposure when listings are canceled, withdrawn, or relisted. That makes direct analysis of the competitive set more useful than relying on one headline average.

If you are considering selling, review the Tallahassee home-selling resources and request a current home evaluation before assuming last year’s strategy still applies.

What The Slowdown Means For Buyers

The Tallahassee housing market slowdown generally gives buyers more time to evaluate choices, but it does not guarantee bargaining power on every home.

A correctly priced property in a low-supply segment can still move quickly. Conversely, an older listing in a high-supply segment may give a buyer considerably more room to negotiate terms.

That makes segmentation essential. Look at the specific ZIP code, price tier, property type, condition, and recent competing sales.

Buyers can browse featured Tallahassee homes for sale and set up property alerts so they can distinguish new inventory from homes that have accumulated market time.

Broader economic conditions also matter, but they should not be confused with the local MLS evidence in this report. The Bureau of Labor Statistics Tallahassee economy data provides a useful independent resource for local employment conditions.

Frequently Asked Questions

Is the Tallahassee housing market slowing down?

Yes. The supplied MLS graphs show longer reported market times, a smaller share of homes selling within 30 days, more sales exceeding 60 days, and substantial year-over-year increases in reported DOM across many Tallahassee ZIP codes.

How long does it take to sell a home in Tallahassee in 2026?

Leon County existing-home sales averaged 94 reported days on market through July 2026. Individual Tallahassee ZIP codes vary widely, so the county average should not be treated as the expected selling time for every property.

Which Tallahassee ZIP codes are slowing the most?

The year-over-year ZIP graph shows the largest percentage increases in 32304 and 32347, followed by 32303 and 32346 among the ZIP codes displayed. Sales volume matters, however. 32347 had only 37 sales, while 32304 had 147 and 32303 had 352.

Does longer market time mean Tallahassee is a buyer’s market?

Not everywhere. The supply graphs show large differences by ZIP code and price range. Some segments have relatively tight supply while others have substantially more inventory relative to their sales pace.

Why can MLS days on market understate actual market exposure?

A property can be canceled, withdrawn, or relisted in ways that reset the reported listing period. When previous exposure is not fully reflected in the reported DOM, the MLS statistic understates the property’s true time exposed to the market.

Should sellers lower their asking price because the market is slowing?

Not automatically. Sellers should first compare their home with the correct location, price range, condition, and competitive inventory. The slowdown makes accurate initial positioning more important, not indiscriminate discounting.

The Market Has Changed, But The Details Matter Most

The Tallahassee housing market slowdown is broad enough to take seriously. Market time is rising, fast sales represent a smaller share of transactions, and many ZIP codes are seeing substantially more homes take longer than 60 days to sell.

But this is not one uniform market.

The difference between roughly three months and ten months of supply is enormous. So is the difference between a high-volume ZIP code with an 80-day average and a thinly traded area where a handful of unusual sales can push the average above 200 days.

That is the central message of this report: Tallahassee is slowing, but location and price segmentation increasingly determine what that slowdown means to an individual buyer or seller.

We Are Here To Help

Whether you are buying, selling, or simply trying to understand what your home is worth in today’s changing market, local data is most useful when it is applied to the property and price range that matter to you.

The Joe Manausa Team at Xcellence Realty can help you interpret the current numbers and make a decision based on your specific situation.

Your Local Expert In Tallahassee

When moving to, in, or from Tallahassee, you will fare better if you work with a local expert. We are here to help. If you have further questions on the Tallahassee real estate market, you can leave a comment below, give us a call at (850) 366-8917, or drop us a note and we'll give you the local information needed to ensure a successful, smooth transaction.

As a local born and raised in Tallahassee with a focus on customer service, I promise you'll find great success when working with the Joe Manausa Team at Xcellence Realty, just as have our past customers. You can read thousands of their reviews reported on Google, Facebook and Zillow right here: Real Estate Agent Reviews Tallahassee.

The digital marketing guide for small businessesHave you heard about my new book "The Business of Getting Business?" It's a comprehensive guide for small businesses to help them make the move to digital. For those of us who want to survive and thrive in a world where large corporations are taking over, it is a must-read. It's also the perfect guide for how to sell a home in the digital age. You can find The Business Of Getting Business by clicking on any of the trusted retailers below.

Real Estate Agent reveals in Tallahassee, Florida

Think all REALTORS are alike?

Read what people are saying about working with the Joe Manausa Team at Xcellence Realty! You can see thousands of real customer reviews reported on Google, Facebook and Zillow at this link: CLICK HERE FOR REAL ESTATE AGENT REVIEWS.
Related Posts