 A quartile housing report is like a median housing report on steroids, it gives you 3 times the information about what people are spending on homes.
Today, we open up with a list of homes for sale in Tallahassee priced around the median, and then we expand into a report to show our readers how Tallahassee home spending breaks down in each quadrant.
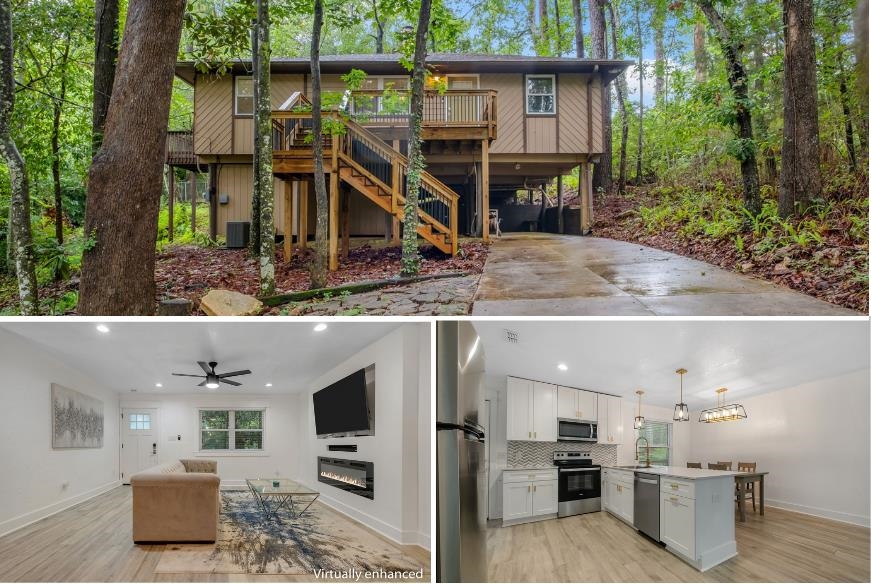
Median Priced Homes For Sale In Tallahassee
Median Homes For Sale



Quartile Housing Report Video
How Quartiles Are Used To Study Home Sales
Don’t be confused by the term “quartile,” it has nothing to do with “quarterly” or any other time frame. Instead, it is a process of segmenting home sales by price.
When we identify the median home price in Tallahassee, we know that 1/2 of all home sales are below that price, and the other half is above that price.
But what if we want to dig deeper?
What if we wanted to know the median between 0 and the median? Or how about a median between the median and the highest priced sale?
That’s what the quartile function allows us to do, so instead of getting two segments of the housing market (high and low), we now get four.
- The first quartile returns the bottom 25% of all home sales based upon price.
- The second quartile is all homes priced between the bottom quartile and the median.
- The third quartile is all homes from the median to the top quartile.
- The fourth quartile returns the top 25% of all home sales based upon price.
Tallahassee Home Sales By Quartile

The graph above reveals the boundaries of each quartile for each of the four quadrants of Tallahassee.
The blue line demarks the boundary between the first and second quartile, the red line (also known as the median), identifies the boundary between the second and third quartile, and finally, the silver line shows where the fourth quartile begins.
This information is useful as it compares the general affordability of homes across Tallahassee. For example, the amount of money you spend in the least expensive quartile in NE Tallahassee could put you among the most expensive quartiles on the west side of town.
We can get a better feel for quartile feedback by looking at each quadrant separately, so I’ve produced the pie-charts below to go into further detail.
Northeast Tallahassee Home Price Quartiles
For each of the quadrants, I have assembled a pie chart that shows each quartile of home prices. The 1st quartile is shown in blue, the 2nd in orange, the third in gray, and the fourth is displayed in yellow.

It’s amazing how far Northeast Tallahassee has recovered since the bottom of the housing market in 2012. If you spent $220,000 on a home in Northeast Tallahassee today, it will be among that cheapest 25% of all NE Tallahassee homes.
Another interesting point here is that 1/2 of the market in Northeast Tallahassee paid between $222K and $375K. as $153K separates the top quartile from the bottom.
Northwest Tallahassee Home Price Quartiles
Northwest Tallahassee is far more affordable than is NE Tallahassee. As noted prior, the fourth quartile here has homes that would be in the first quartile in NE Tallahassee.

It will be interesting to see how the quartiles move in NW Tallahassee in the future. So much of this has to do with student housing. Will the pandemic push students away from the large new complexes and back towards single-family detached homes and townhouses?
Even after there is a cure, I suspect there might be some societal changes in regard to social distancing and the desire to live among so many other people. It’s hard to forecast what people will do, but we do need to acknowledge that we could be in for a major reversal in how students want to live.
If students do move away from the large apartment complexes, then I believe we’ll see the same historic appreciation rate for investment homes rented to students. But what if the pandemic has no long-term impact on the trend of students moving to the large apartment complexes?
What if the brand-new large four-bedroom, four-bathroom apartments remain super popular? If this is the case, we’ll see a lot of the prior student rentals renovated and then sold to first-time homebuyers and young families. This would (in my opinion) accelerate appreciation and we would see the lowest quartile in NW Tallahassee rise dramatically.
One-half of all buyers in NW Tallahassee paid between $108K and $207K (roughly a $100K difference).
Southeast Tallahassee Home Price Quartiles
There are so many more observations we can make with this quartile information, so if you see something important that I do not point out, please share it in the comments section below.

Due to the influence of Southwood, Southeast Tallahassee is seeing the middle and higher price points getting costlier.
One-half of all buyers in SE Tallahassee paid between $140K and $294K (the difference of $154K being very similar to NE Tallahassee).
Southwest Tallahassee Home Price Quartiles
The least expensive homes can be found in Tallahassee’s SW quadrant.

Here, you can still buy about 1/3rd of the homes for less than $100K, though I suspect that won’t last very long. The middle of the market goes from $80K to $172K, a $93K difference that is similar to what we observed in NW Tallahassee.
Overall, the quartile report shows that the east side of Tallahassee is more expensive than the west side, just as the north side is more expensive than the south side.
One final observation that hits me is that it is getting nearly impossible to build single-family detached homes at prices below the top quartile. Could this be a sign that new homes will only be available for the wealthiest 25% of homebuyers in Tallahassee?