
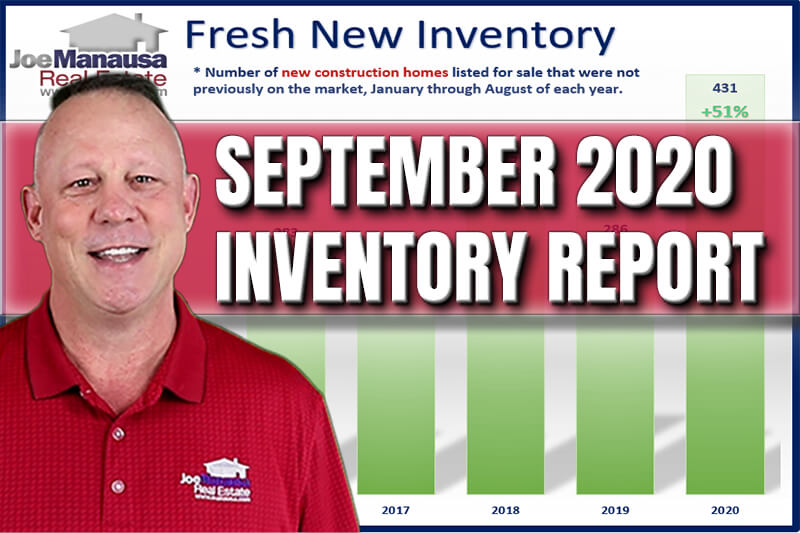
 The supply-side of the housing market has slowed progress for the past 6 months, so today’s report will examine and reveal what is happening to the inventory of homes for sale in Tallahassee.
We have included five important graphs and provided an explanation of each, after which you should be fully informed about the supply of homes in the market.
Start by looking at the current listings for sale in Tallahassee. They are sorted from highest to lowest price. As you scroll down by asking price, the percentage of homes under contract goes through the roof.
There are even more homes for sale marked “pending,” though they have been removed from our search because they are soon to close with qualified buyers.
Listings In The Tallahassee Housing Market
Tallahassee Homes for Sale


This week’s housing market report focuses on the supply-side of the Tallahassee real estate market. We’ll examine several different graphs that depict the current state of the inventory shortage in the housing marketing, starting with year-over-year fresh listings and culminating with a look at how well the new homes market is faring in its attempt to satisfy the need for more new homes.
Year Over Year New Listings Decline
Our first graph in today’s report shows year-over-year fresh listings. “Fresh” means that the home has not been recently listed for sale with its current or another real estate company.
Each line in the graph below measures the percentage change in fresh listings from the same month the prior year. A green line reports growth, while a red one reveals a decline.

The COVID-19 pandemic is having a clear impact on existing home sellers entering the market. The past five months have shown fewer homes listed each month than in the same five months of 2020.
We saw about 12% fewer fresh listings in August than were recorded in August 2019, showing that a percentage of homeowners are still leary about listing their home during these trying times.
I believe some of this might be related to job uncertainty and some is related to the concern for safety from the virus. Either way, the decline in fresh listings is keeping the market grossly undersupplied of homes for sale in Tallahassee.
The next graph shows the seasonal nature of sellers entering the market and might help us forecast the likely listing activity in the following months.
When Sellers Normally List Their Home
This graph uses the fresh listings reported from 2013 through 2019 (seven full years) to establish the listing behavior of existing homeowners in Tallahassee.

Historically, the months of September through December yield the fewest fresh listings of all months of the year. Does that mean we should expect to see the same in 2020?
Normally, I would answer with an unequivocal “YES” to that question. But here is why I have some doubts and think we might just see a different pattern this year.
First of all, demand is scorching hot right now. We are seeing multiple offers on most of our listings and that means there are plenty of buyers awaiting new homes. Those that get listed and marketed properly, will get sold.
Second, there is a growing pool of pent-up supply. This is that group of homeowners who have chosen not to enter the market due to the COVID-19 pandemic. Now that the economy is recovering and people are getting back to work, many of these homeowners are going to want to take advantage of historically low mortgage interest rates. They will need to sell their homes for their move to their new homes.
Third, I expect to see less travel and smaller gatherings during the holiday season. The holidays are typically the #1 reason that we hear from sellers about why they want to wait to list until the new year. This year, they will have less reasons to wait.
When you put all three of those factors together, I think there is a good chance that we’ll see some year-over-year gains in the months to come. The market is too hot to ignore for people with homes to sell. In fact, our next graph will reveal just how hot it is for sellers.
Home Seller Success Rate
This graph measures what I call the “home seller success rate.” As simple as this graph appears to be, it actually takes many hours each month to produce. We have to remove a lot of duplicate information in the MLS in order to find out the percentage of sellers who are successful in selling their homes with their first real estate agent.

I really wish I had the data to show you what this graph looked like back in 2008 through 2012. At one point, I had measured the success rate to be just below 40%, can you imagine. Back then, less than 4 out of every 10 home sellers got their home sold during their first 6 month listing period.
But times change and market conditions are ripe for home sellers. The graph above shows that 87% of home sellers right now are getting their homes sold with the first agent hired.
To say that “now is the time to sell” is a gross understatement.
Our final two graphs are going to clearly reveal the impact that concerned homeowners are having on the inventory of homes for sale in Tallahassee, as well as the impact that local builders are bringing. Can we build our way out of a housing shortage?
Year To Date New Listings
This graph measures the fresh, existing homes entering the market from January through August of each year. This means that it DOES NOT include new construction homes (which will be examined in the final graph) and it does not include sellers who had been listed with a previous company.
For those readers who understand how the MLS works, it also shows each listing on the date it was initially listed. So those agents who keep canceling and relisting their unsold properties do not have an effect on this report.

Thus far in 2020, through August, there have been 3,148 fresh homes listed for sale in the Tallahassee MLS. That is 15% fewer than last year and the fewest of the past 20 years, though I only have the data shown for the past seven years.
Remember, this does not include new construction, just existing homeowners deciding (for the first time) to enter the market.
This 15% decline is 545 homes that the market desperately needs and represents pent-up supply that will eventually find its way to the market. Will they all hit in the Spring, or will some enter in the final quarter of 2020? Time will tell.
Either way, they will be consumed by the pent-up demand from buyers who cannot find homes right now (unless the builders beat them to the buyers).
Year To Date New Construction Homes Listed
It appears as if the home builders in Tallahassee have heard our pleas as the construction of new units is growing.
Our final graph shows the new construction homes listed for sale in the Tallahassee MLS from January through August of each year going back to 2014.

It’s nice to see that the construction of new homes is up 51% in 2020 versus what we saw a year ago. This is rather impressive as I can imagine that builders and their subcontractors are dealing with the impact of the COVID-19 pandemic.
This graph shows listings, not sales, so we’ll have to keep an eye out on closings and then report back to you on whether or not these new homes are making it to the closing table. I have heard reports about a backlog of various materials and appliances that new homes require.
What To Do If You Have A Home To Sell
The smartest thing you can do if you have a home to sell is to spend a few minutes discussing your needs and wants with a listing specialist. In fact, you can book a 15-minute call right here if you like. There are no strings attached and we’ll listen to what you want to accomplish and let you know if it is possible in today’s climate.
TEMP

Tallahassee Housing Economic Update

Tallahassee Florida Spring Economic Update

Tallahassee/US Housing Market Update Feb 2024

Which Home Sizes Are Skyrocketing In 2024?

Top 10 Neighborhoods to Live in Tallahassee for Families

Wealth Gap Widens Luxury Home Market Booms Unprecedentedly
How Bad Is It? SHOCKING Building Permits Report!

Top 10 Patio Home Neighborhoods In Tallahassee