Yesterday was a busy day, as we posted the 6th edition of the Tallahassee Real Estate Newsletter. You can subscribe to the newsletter (in the sidebar to the right) in order to have it delivered right to your email inbox when it is published.
I noticed after publishing the newsletter yesterday that a few people quit their subscription. One in particular commented that I was writing “too much doom and gloom” and he no longer wished to receive the newsletter. So with this in mind, I’m changing the news …. just kidding. But I will work harder to point out the good news that is out there when I find it.
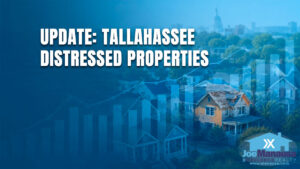
Positive Signs In The Tallahassee Real Estate Market
One real estate graph that we feature at The Market Bulletin is called the “Key One-Year MLS Trends.” It measures the one-year trend on some important ratios as well as the overall housing inventory change trend. In the graph below, the yellow line (measured on the right vertical axis) shows what the one-year home inventory change trend is doing in the Tallahassee Board of REALTORS® Multiple Listing Service (MLS).

Right now, our graph shows us that we currently have 954 fewer homes on the market than we did one year ago. That is GOOD NEWS for the Tallahassee real estate market. Reduction of the glut of inventory is very important in getting this market back on stable ground. So what else is the real estate graph telling us?
- Homes Coming “Back On The Market” are happening more often, up 86% since December. The blue line in the graph shows that we are seeing a much higher percentage of homes that failed to sell get re-listed for sale on the market. We track this number to get a feel of what percentage of the market has “been here before.”
- Homes that “Failed To Sell” have risen 10% since December. The red line in the graph shows that over the past year, the number of homes that did not sell (meaning the listing period ended without a sale) divided by the homes that were listed for sale, was 79%. One could generally conclude that over the past twelve months, 79% of the home listed failed to sell.
- Homes that “Sold” have dropped by 15% just since December. The green line in the graph depicts our rate of sales versus our rate of new listings is getting worse, due primarily to the incredible reduction in the number of buyers in the Tallahassee real estate market. This is not good news, but the declining green line in the real estate graph should not be ignored. We need to see increased buyer activity for this market to turn.
The reason that the federal government continues to talk about “stimulus” is because buyer activity has slowed in nearly every market, not just real estate. The good news for us in real estate is that even though we are seeing incredibly slow buyer activity, real inventory levels are falling. The Tallahassee housing market will recover when buyer confidence is again restored.

| Subscribe in a reader | Subscribe by email |
As a reminder for those who subscribe to the Tallahassee Real Estate Blog by email, some embedded pictures and videos might not be appearing in your email and you might need to click the title header to go to your browser where all will be visible. Additionally, if you would like to respond (leave a comment) to this article, you will need to “click through” to the blog site to post your feedback.
If you like this Article then please subscribe to my blog through a full RSS feed, or you can Subscribe by Email.You will be able to stay informed about the happenings in the Tallahassee Real Estate Market.


Please Do Us A Small Favor
We work very hard to produce daily content for our long-time readers and first-time visitors. We provide this information for free, hoping to earn your respect and trust and the right to one-day help you when selling or buying a home. Can we get your help spreading the word about our blog?
If you like the content, would you please like it or share it using the Facebook button at the beginning of the post? This simple action will be greatly appreciated! THANK YOU!

Also like us on Facebook at https://www.facebook.com/joemanausarealestate/
Your Local Expert In Tallahassee
When moving to, in, or from Tallahassee, you will fare better if you work with a local expert. We are here to help. If you have further questions on the Tallahassee real estate market, you can leave a comment below, give us a call at (850) 366-8917, or drop us a note and we’ll give you the local information needed to ensure a successful, smooth transaction.
As a local born and raised in Tallahassee with a focus on customer service, I promise you’ll find great success when working with Joe Manausa Real Estate, just as have our past customers. You can read thousands of their reviews reported on Google, Facebook and Zillow right here: Real Estate Agent Reviews Tallahassee.
 Have you heard about my new book “The Business of Getting Business?” It’s a comprehensive guide for small businesses to help them make the move to digital. For those of us who want to survive and thrive in a world where large corporations are taking over, it is a must-read. It’s also the perfect guide for how to sell a home in the digital age. You can find The Business Of Getting Business from each of the trusted retailers below.

Think all REALTORS are alike?
Read what people are saying about working with Joe Manausa Real Estate! You can see thousands of real customer reviews reported on Google, Facebook and Zillow at this link: CLICK HERE FOR REAL ESTATE AGENT REVIEWS.