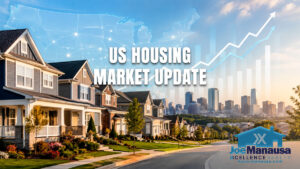
I love sharing the good news about the real estate market. Long-term readers know that I fairly and honestly report what I’m seeing, but I have to say that the good news of the past four years has been so much more fun than what I was sharing back in 2008 through 2014!
Unfortunately, today’s foreboding report is not so fun. Consider this an early warning to prepare yourself for the housing market that is around the corner. Wise readers will take today’s advice to heart and then make decisions that will likely impact their homestead and finances for the next 30 years.
We’ll start by examining the current inventory of homes for sale, and then proceed with a detailed forecast for home affordability through the year 2040.
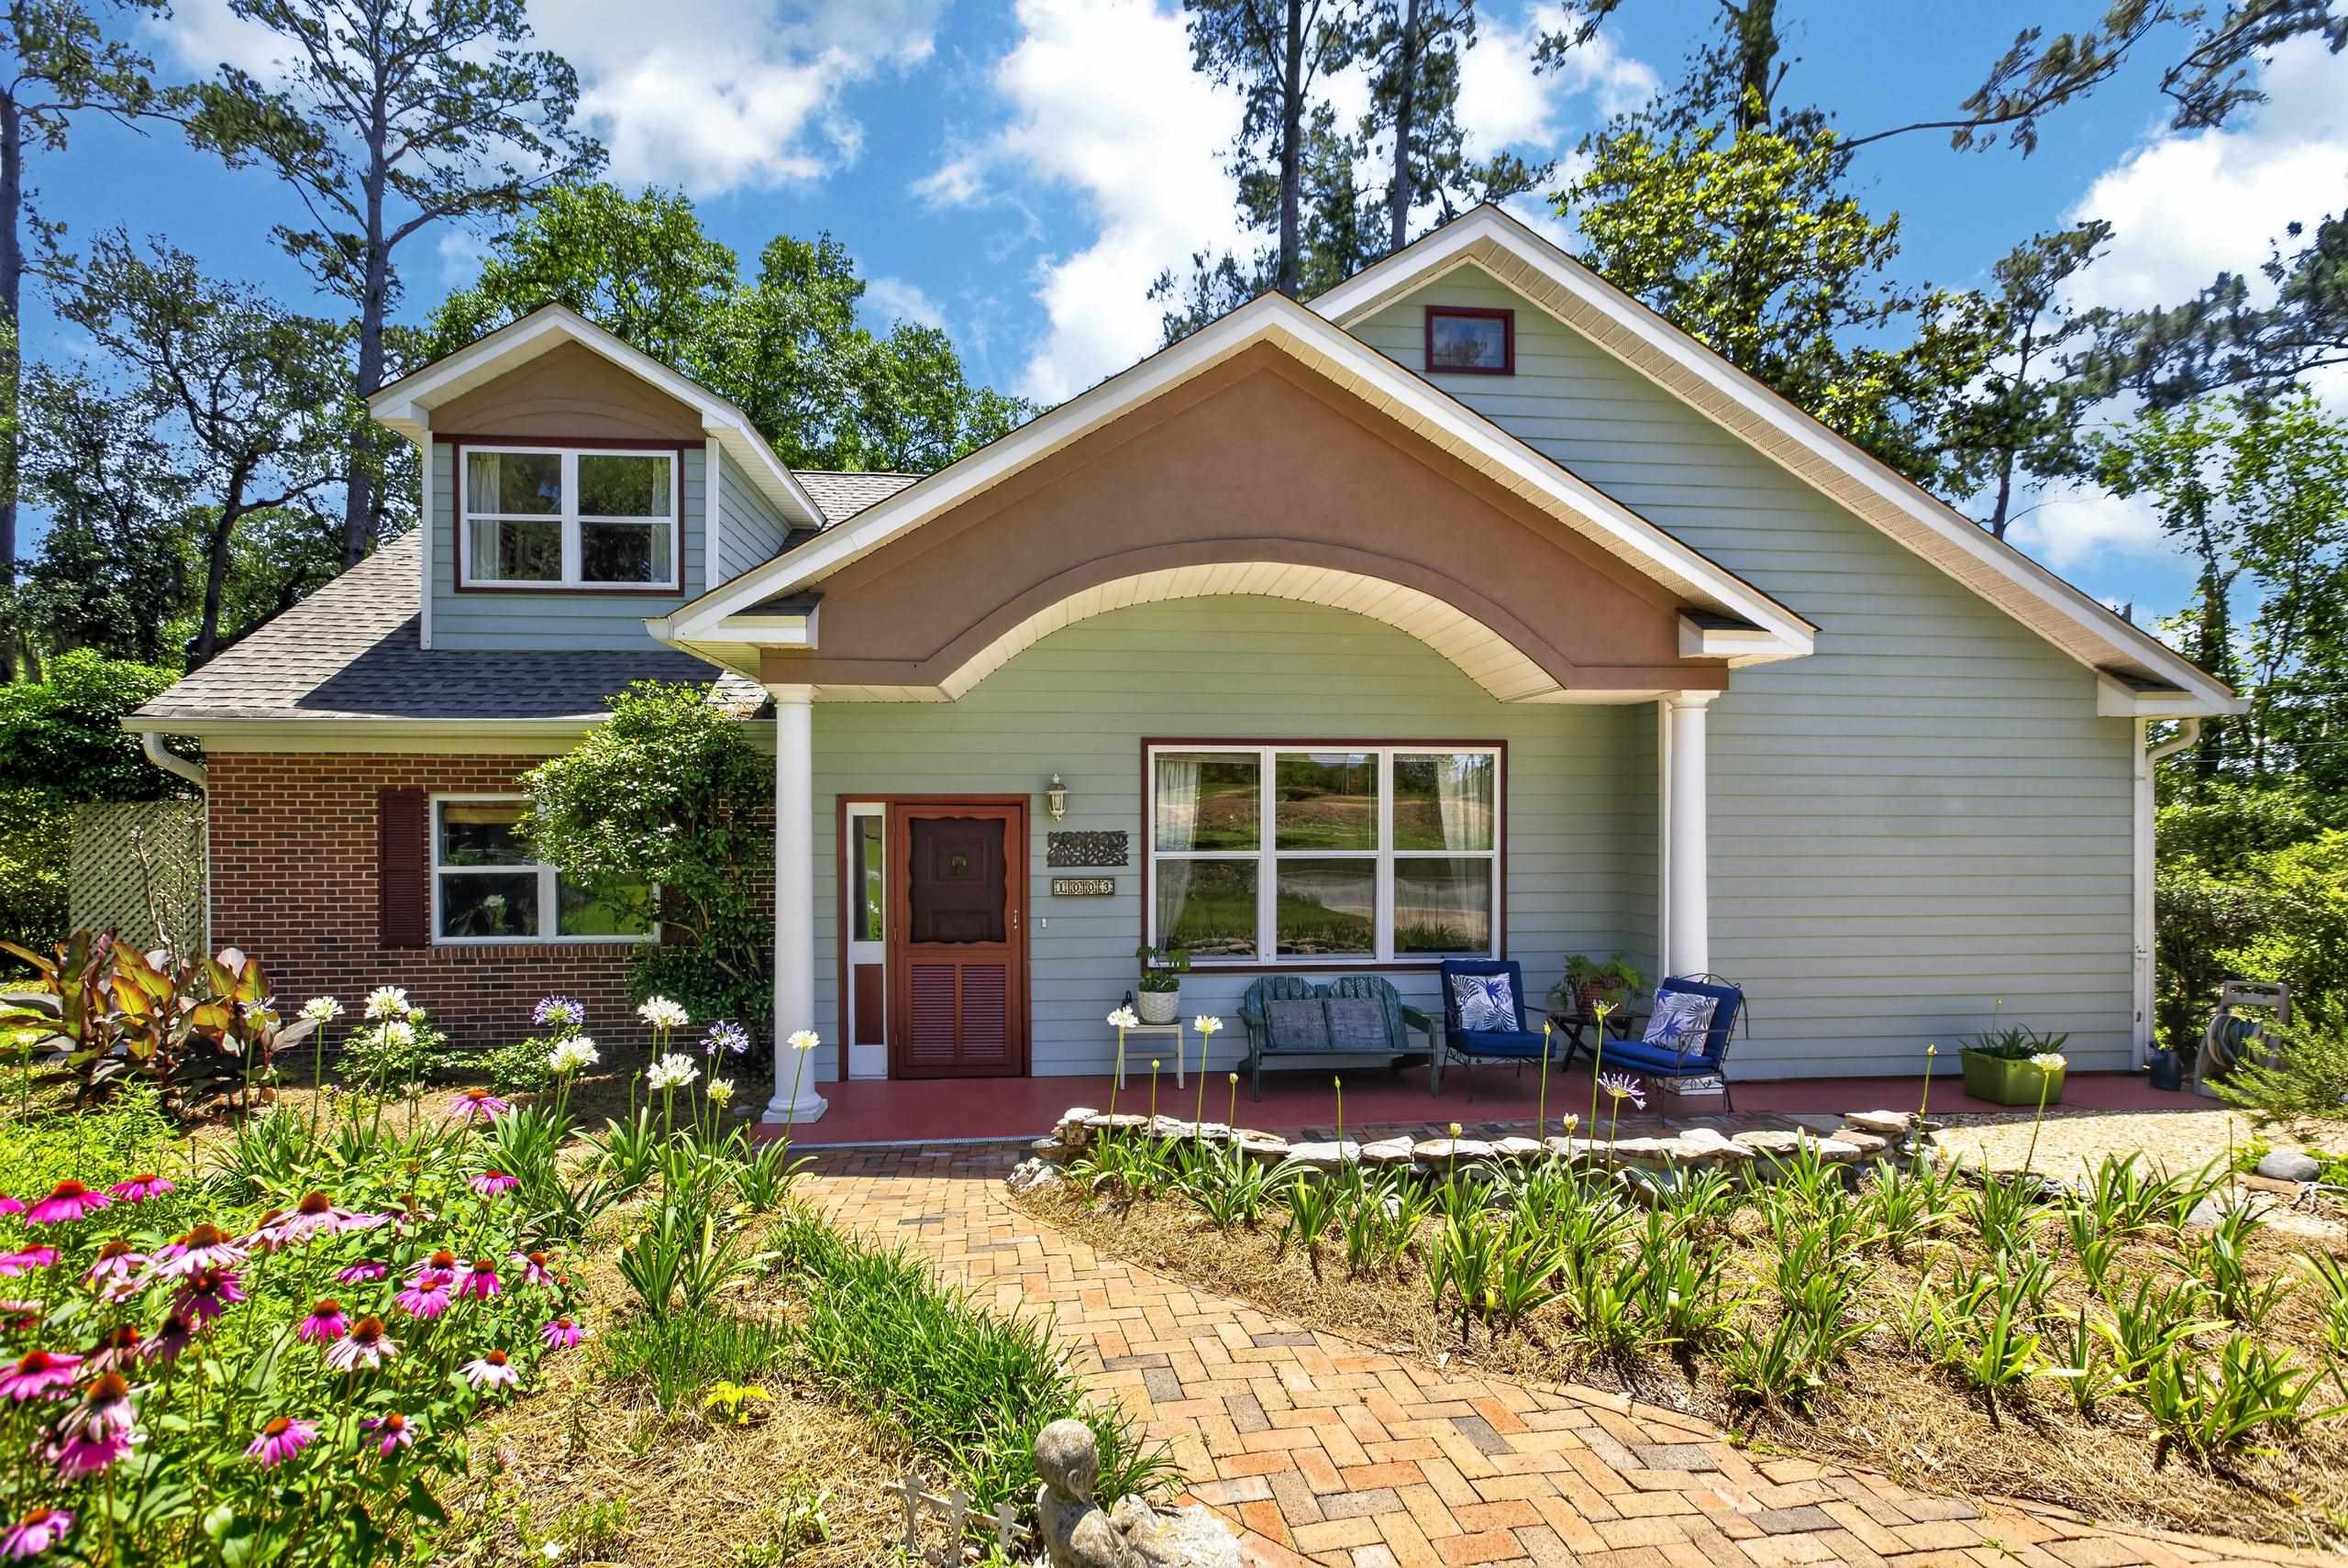
Homes For Sale In Tallahassee Today
The following dynamic list of homes for sale in Tallahassee is updated every 15 minutes, so you can be assured that it’s the best information available on Tallahassee real estate listings.
Before we get into our affordability forecast, please note the large number of listings that are already under contract with buyers.
Tallahassee Homes for Sale


Home Affordability Forecast Video
Home Affordability Forecast
The following graph is a very realistic forecast for the future home prices and mortgage payments Tallahassee homebuyers will face. The numbers are shocking, so I address them in detail below the graph.

The table in the top left section of the graph shows the values used to create the graph. I would think many readers might see this and say “no way this can happen!” After all, look at the significant difference in the slope of the payment and values from the previous 30 years versus the next 20 years.
You might think I just created this for dramatic effect, but that is sadly not the case. So why is home affordability going to explode over the next 20 years?
It’s the confluence of a lot of trends. Number one is mortgage interest rates. The rate borrowers have paid banks and lenders over the past 40 years has been declining fairly consistently. In fact, there are two generations of homeowners who have enjoyed lower rates every time they’ve decided to “move up.” Tomorrow’s borrower is going to be finding generally rising mortgage interest rates, and that is going to negatively impact the move-up buyer.
The table shows a movement in mortgage interest rates based upon Freddie Mac’s forecast for 2021 and 2022, and then I have rates rise only 1/4th of a percent each year thereafter. History suggests this is incredibly conservative and rates will likely go much higher.
The second trend that this graph considers is the rising cost of building homes. The rate at which new construction costs are rising (even ignoring COVID-related surges) is rising. There is a growing need for more inventory, but the land, materials, and labor have made new homes very expensive. Expect this to only get worse. The additional cost of labor resulting from historic changes to the minimum wage will impact all materials and labor required in new home construction.
To put this into perspective, the minimum wage has risen less than 60% over the past 16 years (the last housing expansion phase) but will rise more than 75% over the next five and one-half years. Remember, it’s always the consumer who picks up the tab, so expect new home prices to explode even higher every year.
The final trend is population growth. There are more people living in Tallahassee (and the US too) than there were when the housing market peaked in 2006. The increase in people equates to an increase in the need for housing. Markets all across the US are facing housing shortages, and this is causing real estate appreciation at rates far higher than normal.
There are going to be shortages for at least several more years, so we should expect (and have forecast) real estate appreciation rates higher than the historic norm.
Our next graph takes the information above but then adjusts it with inflation.
Recent Housing Market Reports

Tallahassee Housing Economic Update
Tallahassee Florida Spring Economic Update
Tallahassee/US Housing Market Update Feb 2024
Which Home Sizes Are Skyrocketing In 2024?

Top 10 Neighborhoods to Live in Tallahassee for Families

Wealth Gap Widens Luxury Home Market Booms Unprecedentedly
How Bad Is It? SHOCKING Building Permits Report!

Top 10 Patio Home Neighborhoods In Tallahassee
Existing Homes Update - Tallahassee Real Estate
Inflation-Adjusted Home Affordability Graph
This graph is similar to the previous graph, but it adjusts the prices and payments to 1991 values. We use inflation-adjusted tables and graphs to gain a better understanding of whether or not homeownership is getting less or more expensive.
")
An inflation-adjusted graph allows us to discover the difficulty or ease of homeownership over time. Remember, every year has been adjusted back to 1991 dollars, so a rise is far less affordable than it would be in an unadjusted graph.
The average monthly mortgage payment of $585 in 1991 will become $1967 in 2040, an increase of 236% (without the benefit of inflation to help the borrower make the payment). You must wonder why are things going to get so much worse? After all, (follow the red line in the graph from left to right), the inflation-adjusted housing payment fluctuated upwards and downwards in the past to where today’s payment of $565 (in 1991 dollars) is actually more affordable than was the average mortgage payment 30 years ago.
Unfortunately, this is all about to change.
Variables That Will Determine Home Affordability’s Fate
I believe a version similar to the first graph will come to pass, but I believe we’ll see a very different version of the second graph. Why?
Because home prices exploding are going to be part of the inflation trigger that forces the Fed to raise interest rates. We’re not likely to see interest rates rise gradually as my forecast has used, instead, we’re going to see periods of very high inflation and the Fed will be forced to pull money from the economy in order to slow things down.
The variables that control the fate of home affordability are many, but mortgage interest rates are perhaps as important as all the others combined. My forecast is for rising prices, rising rates, and a decline in home affordability for the foreseeable future.
My best advice is to get as much house as you can possibly handle today because it’s likely you won’t be able to afford to “move up” to a larger home in the future. Unless your personal economics change greatly, the future cost of housing will be a prohibitive block to you buying bigger and better. Remember, not only will the costs be rising, but so too will be the monthly mortgage payment required to make the move.
When moving to, in, or from Tallahassee, you will fare better if you work with a local expert. We are here to help. If you have further questions on the Tallahassee real estate market, you can leave a comment below, give us a call at (850) 366-8917, or drop us a note and we'll give you the local information needed to ensure a successful, smooth transaction.
As a local born and raised in Tallahassee with a focus on customer service, I promise you'll find great success when working with Joe Manausa Real Estate, just as have our past customers. You can read thousands of their reviews reported on Google, Facebook and Zillow right here: Real Estate Agent Reviews Tallahassee.
 Have you heard about my new book "The Business of Getting Business?" It's a comprehensive guide for small businesses to help them make the move to digital. For those of us who want to survive and thrive in a world where large corporations are taking over, it is a must-read. It's also the perfect guide for how to sell a home in the digital age. You can find The Business Of Getting Business by clicking on any of the trusted retailers below.

Think all REALTORS are alike?
Read what people are saying about working with Joe Manausa Real Estate! You can see thousands of real customer reviews reported on Google, Facebook and Zillow at this link: CLICK HERE FOR REAL ESTATE AGENT REVIEWS.