
Today we are going to examine building permits in detail, as the issue of home affordability is going to become one of the most prominent topics for many years in the national media.
The number of new homes and multi-family properties being permitted and built today is far short of what we need and a new housing crisis has formed. I am not warning about a housing bubble, rather I have brought the data that shows how grossly underbuilt the housing market is in 2022.
Follow along as I share graphs and tables that show how the problem formed and what we are facing today. If you believe you might be moving sometime in the next ten years, this is “must-have” information for you to plan your future.
New Construction For Sale In And Around Tallahassee
New Construction For Sale



A Picture Is Worth A Thousand Words
I have been saying (and writing) that we are not building enough homes for more than five years, and the graph below is why I am so confident that it is true.
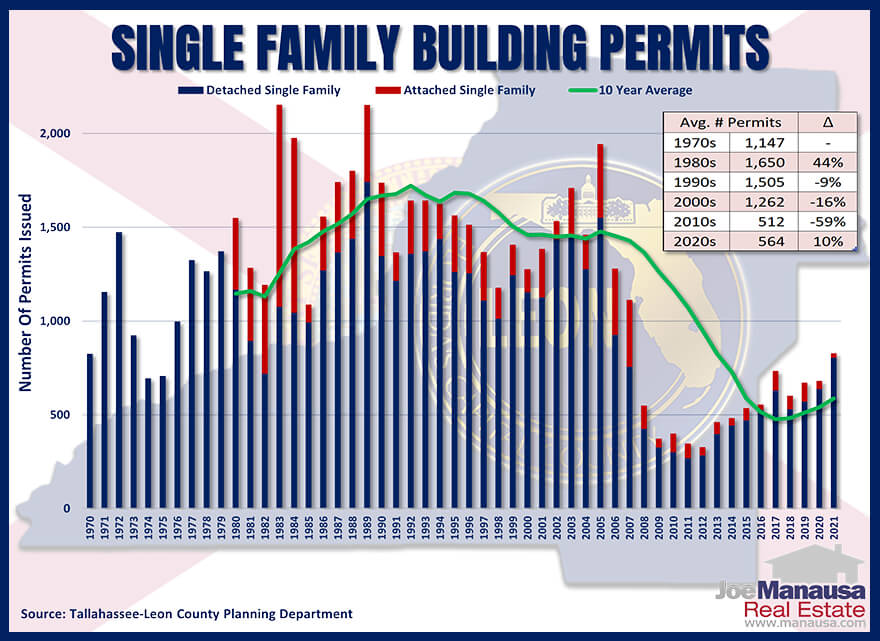
The graph above tracks the number of single-family building permits each year, with detached homes plotted in blue and attached homes plotted in red. The green line plots the total ten-year average.
During the forty-year period from 1970 through 2010, Leon County permitted (on average) nearly 1,500 single-family homes each year, but over the past ten years, that average has declined 58% to just 620 homes per year. This huge decline would not be a big issue if we had been producing multi-family homes to make up the difference. Unfortunately, as you will see in the next graph, that did not happen.
Multi-Family Construction Remains Flat
People have to live somewhere. If not in single-family homes, then multi-family is the most likely alternative.
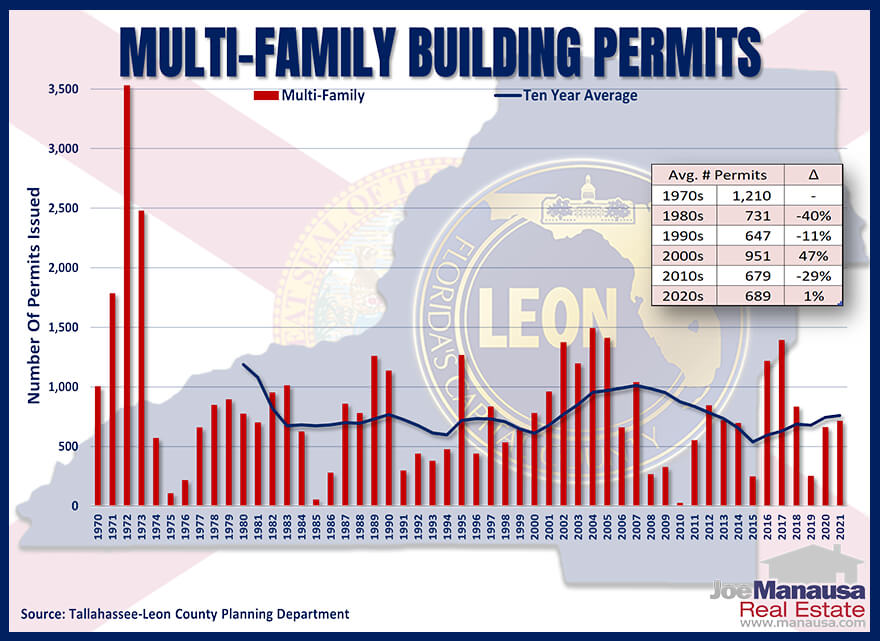
This graph plots the number of multi-family building permits in Leon County each year in red and shows the ten-year average as a solid blue line. While single-family building permits declined by 58%, multi-family permits only rose 1% over the past ten years.
Even with all the new student rental properties built near the universities, there really hasn’t been much change in the multi-family market. I suspect this will be changing as we see interest rates move higher.
Residential Building Permits Paint A Clear Forecast
When we combine single-family permits with multi-family permits, it is clear that we have a major problem in the housing market.

The graph above incorporates the data from the two previous graphs and delivers a conspicuous image of the void in the supply-side of the housing market. The past twenty years (which includes the housing bubble years) have seen residential permits decline by 44% when compared to the average from the previous 40 years.
This is not some short-term glitch in the data, this is a clear sign that we are heading towards a home affordability crisis that will impact both homeowners and tenants alike. Below, we examine some interesting dynamics about home values and how they have changed due to the decline in new construction.
Home Value Changes: New Versus Existing Homes
This graph plots the change in the average price per square foot of new and existing homes. New home values are plotted in red, while existing home values are plotted in blue.

The value of existing homes is completely market-driven; good ‘ol supply and demand at work. But new home values (costs) are far less so. If people are not willing to pay what it costs to build a home, then builders stop building.
The massive reduction in new home construction over the past 15 years has had a visibly significant impact on existing values. With not enough shelter to serve our growing population, existing-home values have been rising fast.
In fact, for the past seven years, we’ve seen existing home values rise at an average annual rate of 6.7% while new home values have risen at an annual rate of 3.3%. This has brought the values of each much closer together as we see in the next graph.
Recent Housing Market Updates

Tallahassee Housing Economic Update

Tallahassee Florida Spring Economic Update
Tallahassee/US Housing Market Update Feb 2024
Which Home Sizes Are Skyrocketing In 2024?

Top 10 Neighborhoods to Live in Tallahassee for Families

Wealth Gap Widens Luxury Home Market Booms Unprecedentedly
How Bad Is It? SHOCKING Building Permits Report!

Top 10 Patio Home Neighborhoods In Tallahassee
Existing Homes Update - Tallahassee Real Estate
The Difference In Values Between New And Used Homes
In this graph, we’ve plotted the average new home value (in price per square foot) in red, and the average existing home value is plotted in blue. The difference (the Delta) is plotted in gray (highlighted in yellow) and is reported on the right vertical axis.
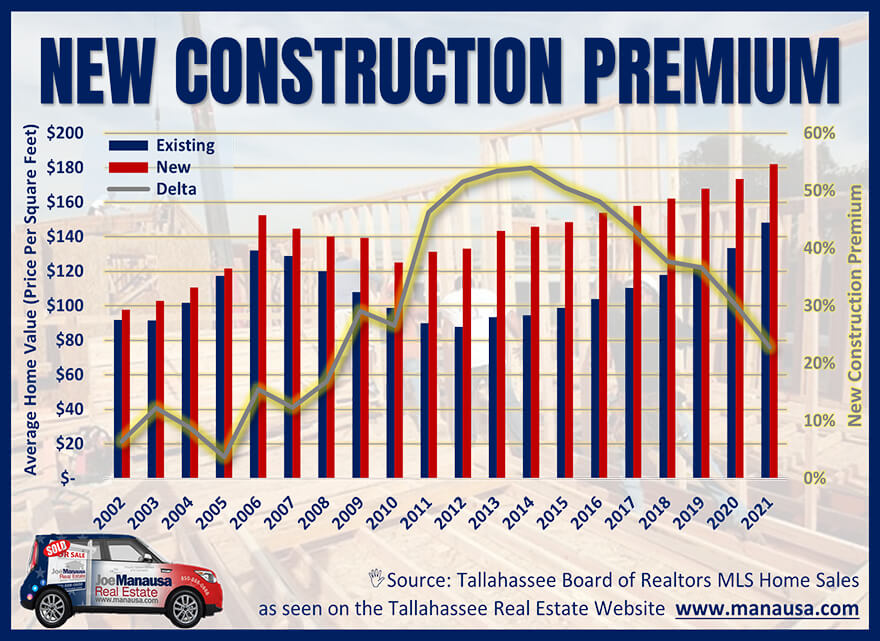
What I’m looking for in this graph is found by following the delta between the two, and it has fallen to just below 22%, the lowest we’ve seen in thirteen years! Simply put, relative to used homes, new homes are more affordable than we’ve seen since 2008!
What’s interesting is that from 2000 through 2007, the average difference in values between new and used was less than 10%. This is an important fact that explains the big difference between today’s soaring market and the market that formed the housing bubble of 2006.
Twenty years ago, builders were able to produce homes for a large portion of the homebuyer pool. But when loan qualification standards were tightened, the number of buyers in the market sunk well below the production volume that builders were producing.
Now contrast that period of change with that of today. Builders have not been able to produce for the vast majority of buyers, as the delta has been far too large due to increased costs of construction, supply chain issues, labor shortages, and a diminished supply of affordable lots. Instead of building for the masses, builders have been restricted to building for a much smaller segment of the population.
This has left us with a supply imbalance that is completely opposite of the housing bubble years. Back then, there were so many speculators in the market, oftentimes buying new construction homes and then flipping them to other buyers after the homes were completed. There are far fewer speculators and the majority of the inventory today is not coming from builders, rather it’s from those homeowners needing to sell their homes because they are buying another one.
As mortgage interest rates rise, we will see a similar effect on the current housing market as did the change in available loan programs had on the 2006 market. We will see demand decline, but this time we are going to see supply diminish too as the majority of today’s inventory is from sellers who are also buyers. So when buyers no longer qualify for what they wish to buy, they will depart the market taking their potential homes to sell with them. In other words, declining demand will also result in declining supply.
Ultimately, what this graph shows is that the high cost of new construction has been pulling up the average value of existing homes, as the lack of supply that is not being replaced by new homes has created the scarcity that provokes runaway appreciation.
And just like the rest of the economy, inflation is going to strike new construction hard this year. Building supplies, labor, and land are all moving higher (faster) this year. I won’t be surprised if new construction costs/values move up 10% or more this year, and we might even see a trend reversal in the delta shown above. This, in turn, will put even more pressure on existing homes, and runaway appreciation is a very likely outcome.
Equally important, it will be interesting to see how the Fed moves this year, as it controls the direction of the housing market. If the Fed keeps the Fed Funds Rate relatively low, builders will have a chance to start filling the void of homes that our growing population needs. But if the Fed responds rapidly (rashly?), I believe the majority of homebuilding could very well move to investors building homes to lease to people who can no longer afford to buy them.
We’ll keep our eye on all the moving pieces of the housing market and let you know through our regular reports here and on our YouTube Channel. For our readers who are curious where new homes are selling today, you can see a table of the most recent new construction home sales below.
Recent New Home Construction Sales
The following table shows the most recent 1,000 new home sales in Tallahassee. Please note that you can sort the table by clicking on any column header.
New Construction Sales In Tallahassee
| Neighborhood | Address | Price | Price / SQF | Closing Date | Year Built | SQF |
|---|---|---|---|---|---|---|
| Canopy | 3917 Ardmore Ln | $600,000 | $252 | 2026-10-09 | 2026 | 2,378 |
| Fletcher Oaks | 487 Grand Oaks Rd | $405,000 | $225 | 2026-10-09 | 2023 | 1,804 |
| Campbell Park | 3399 Mizell St | $290,000 | $223 | 2026-10-07 | 2026 | 1,301 |
| Fallschase | 540 Bienville Pl | $687,900 | $238 | 2026-10-01 | 2026 | 2,890 |
| Plaza Tower | 300 S Duval St | $310,000 | $261 | 2026-10-01 | 2009 | 1,186 |
| Fallschase | 4106 Beauregard Way | $460,000 | $209 | 2026-09-30 | 2026 | 2,200 |
| Fallschase | 543 Bienville Pl | $369,100 | $240 | 2026-09-30 | 2026 | 1,535 |
| Landon Hills | 8364 Bull Headley Rd | $451,600 | $251 | 2026-09-30 | 2025 | 1,802 |
| Landon Hills | 8388 Bull Headley Rd | $441,600 | $245 | 2026-09-29 | 2026 | 1,802 |
| Abilene Acres | 709 Dailey Dr | $279,900 | $192 | 2026-09-28 | 2026 | 1,459 |
| Pine Dove Estates | 5576 White Dove Trl | $435,000 | $242 | 2026-09-28 | 2026 | 1,799 |
| Fallschase | 420 Kenyon Pl | $339,900 | $179 | 2026-09-25 | 2026 | 1,895 |
| Canopy | 3925 Ardmore Ln | $575,300 | $250 | 2026-09-23 | 2026 | 2,302 |
| Tower Gates | 4498 River Breeze Ln | $298,000 | $217 | 2026-09-23 | 2025 | 1,374 |
| Plaza Tower | 300 S Duval St Apt 1111 | $315,000 | $265 | 2026-09-21 | 2009 | 1,188 |
| Canopy | 3749 Meadow Vista Ln | $426,600 | $236 | 2026-09-18 | 2025 | 1,804 |
| Fallschase | 215 Calcasieu Pass | $499,900 | $218 | 2026-09-18 | 2026 | 2,295 |
| Fallschase | 517 Dartez Ct | $399,900 | $239 | 2026-09-18 | 2026 | 1,670 |
| Capital Heights | 530 W 4TH Ave | $315,000 | $222 | 2026-09-18 | 2026 | 1,420 |
| Abilene Acres | 4876 Six Mile Pond Loop | $289,900 | $199 | 2026-09-18 | 2026 | 1,459 |
| None | 1520 Summerbrooke Dr | $530,700 | $283 | 2026-09-16 | 2026 | 1,873 |
| Fallschase | 424 Kenyon Pl | $342,900 | $181 | 2026-09-15 | 2026 | 1,895 |
| The Franklin | 275 S Franklin Blvd Unit 6 | $680,000 | $334 | 2026-09-15 | 2025 | 2,038 |
| Abilene Acres | 4884 Six Mile Pond Loop | $302,300 | $206 | 2026-09-15 | 2026 | 1,470 |
| Olson Ridge | 2951 Ervine St | $400,900 | $177 | 2026-09-14 | 2025 | 2,259 |
| Southwood | 4075 Four Oaks Blvd | $399,900 | $236 | 2026-09-11 | 2026 | 1,695 |
| None | 1536 Summerbrooke Dr | $598,100 | $233 | 2026-09-08 | 2025 | 2,572 |
| Pine Dove Estates | 5360 Pine Dove Dr | $562,900 | $195 | 2026-09-04 | 2026 | 2,890 |
| Canopy | 3789 Meadow Vista Ln | $661,600 | $256 | 2026-09-03 | 2026 | 2,582 |
| Conservation Of Summerbrooke | 1491 Summerbrooke Dr | $629,900 | $243 | 2026-09-03 | 2026 | 2,589 |
| Fallschase | 418 Kenyon Pl | $339,900 | $179 | 2026-08-31 | 2026 | 1,895 |
| Fallschase | 416 Kenyon Pl | $349,000 | $186 | 2026-08-31 | 2026 | 1,876 |
| Conservation Of Summerbrooke | 1431 Summerbrooke Dr | $532,800 | $284 | 2026-08-31 | 2025 | 1,873 |
| Hammock At Oak Grove | 589 Knotted Pine Dr | $581,300 | $272 | 2026-08-28 | 2026 | 2,137 |
| Hammock At Oak Grove | 585 Knotted Pine Dr | $619,900 | $291 | 2026-08-25 | 2024 | 2,130 |
| None | 8548 Scott Tower Rd | $580,000 | $269 | 2026-08-24 | 2026 | 2,160 |
| Landon Hills | 1379 Landon Hills Dr | $248,000 | $194 | 2026-08-21 | 2026 | 1,280 |
| Pine Dove Estates | 5584 White Dove Trl | $564,900 | $195 | 2026-08-21 | 2026 | 2,890 |
| Fallschase | 4110 Beauregard Way | $503,500 | $197 | 2026-08-20 | 2026 | 2,550 |
| None | 1568 Summerbrooke Dr | $590,900 | $230 | 2026-08-20 | 2026 | 2,572 |
| Conservation Of Summerbrooke | 1488 Summerbrooke Dr | $504,200 | $269 | 2026-08-19 | 2025 | 1,873 |
| Pine Dove Estates | 7921 Lonesome Dove Ln | $526,800 | $217 | 2026-08-17 | 2026 | 2,429 |
| Canopy | 3909 Ardmore Ln | $647,400 | $251 | 2026-08-14 | 2026 | 2,582 |
| Canopy | 3799 Day Garden Dr | $442,000 | $224 | 2026-08-14 | 2023 | 1,975 |
| Homestead Ridge | 9350 Powderhorn Ave | $370,500 | $268 | 2026-08-14 | 2025 | 1,384 |
| None | 1552 Summerbrooke Dr | $834,800 | $242 | 2026-08-11 | 2026 | 3,447 |
| Fallschase | 4102 Beauregard Way | $450,000 | $205 | 2026-08-07 | 2026 | 2,200 |
| Town N Country Park | 934 Chestwood Ave | $367,200 | $245 | 2026-08-07 | 2026 | 1,501 |
| Fallschase | 519 Bienville Pl | $410,000 | $209 | 2026-08-05 | 2026 | 1,964 |
| Tower Gates | 4470 River Breeze Ln | $335,100 | $210 | 2026-08-05 | 2025 | 1,592 |
| Fallschase | 4272 Duhon St | $543,600 | $211 | 2026-08-04 | 2026 | 2,572 |
| Southwood | 4073 Four Oaks Blvd | $410,700 | $242 | 2026-07-30 | 2026 | 1,695 |
| Canopy | 2832 Mews Lndg | $305,700 | $239 | 2026-07-28 | 2026 | 1,280 |
| Bond South | 2002 Pasco St | $225,000 | $203 | 2026-07-24 | 2026 | 1,109 |
| Bond South | 2006 Pasco St | $225,000 | $203 | 2026-07-24 | 2026 | 1,109 |
| Conservation Of Summerbrooke | 1504 Summerbrooke Dr | $696,200 | $270 | 2026-07-23 | 2026 | 2,582 |
| Reserve At Rivers Landing | 4899 Sampler Dr | $311,000 | $225 | 2026-07-22 | 2026 | 1,382 |
| Tower Gates | 5736 Pinebarren Rd | $324,000 | $230 | 2026-07-20 | 2025 | 1,409 |
| Landon Hills | 1354 Landon Hills Dr | $402,500 | $248 | 2026-07-17 | 2024 | 1,622 |
| Canopy | 3905 Ardmore Ln | $599,800 | $252 | 2026-07-15 | 2026 | 2,378 |
| Canopy | 3829 Ardmore Ln | $579,600 | $252 | 2026-07-14 | 2025 | 2,302 |
| Canopy | 2349 Briar Rose Gln | $330,000 | $264 | 2026-07-10 | 2025 | 1,252 |
| Fallschase | 4236 Landry Ln | $440,500 | $279 | 2026-07-09 | 2026 | 1,580 |
| Landon Hills | 8373 Bull Headley Rd | $464,900 | $216 | 2026-07-08 | 2026 | 2,149 |
| Waterford Plantation | 6286 Longwood Ct | $557,000 | $257 | 2026-07-02 | 2024 | 2,170 |
| Canopy | 2374 Briar Rose Gln | $431,600 | $240 | 2026-07-01 | 2025 | 1,802 |
| Hammock At Oak Grove | 649 Knotted Pine Dr | $613,400 | $272 | 2026-07-01 | 2026 | 2,255 |
| Conservation Of Summerbrooke | 1471 Summerbrooke Dr | $667,900 | $259 | 2026-07-01 | 2026 | 2,582 |
| Maple Ridge | 2351 Maple Leaf Way | $1,420,000 | $310 | 2026-07-01 | 2024 | 4,587 |
| Fallschase | 515 Bienville Pl | $370,000 | $241 | 2026-06-30 | 2026 | 1,535 |
| Fallschase | 505 Dartez Ct | $399,900 | $239 | 2026-06-30 | 2026 | 1,670 |
| Southwood | 4061 Brownstone Way | $381,200 | $212 | 2026-06-30 | 2025 | 1,799 |
| Fallschase | 507 Bienville Pl | $430,000 | $196 | 2026-06-29 | 2026 | 2,198 |
| Conservation Of Summerbrooke | 1479 Summerbrooke Dr | $587,000 | $228 | 2026-06-29 | 2026 | 2,572 |
| Pine Dove Estates | 5598 White Dove Trl | $566,900 | $196 | 2026-06-29 | 2026 | 2,890 |
| Fallschase | 457 Dartez Ct | $399,900 | $239 | 2026-06-26 | 2026 | 1,670 |
| Tower Gates | 5700 Flowerbrook Cir | $340,000 | $214 | 2026-06-26 | 2026 | 1,592 |
| Pine Dove Estates | 5368 Pine Dove Dr | $624,900 | $205 | 2026-06-26 | 2026 | 3,044 |
| None | 1007 Williams Landing Rd | $1,169,000 | $408 | 2026-06-25 | 2024 | 2,864 |
| Key Acres | 2715 Gerald Dr | $295,800 | $164 | 2026-06-25 | 2023 | 1,800 |
| University Green | 1978 Greencastle Ln | $229,900 | $187 | 2026-06-23 | 2026 | 1,232 |
| Canopy | 3737 Meadow Vista Ln | $425,000 | $236 | 2026-06-22 | 2025 | 1,802 |
| Fallschase | 4247 Thibodeax Trl | $529,900 | $231 | 2026-06-22 | 2026 | 2,295 |
| Fallschase | 425 Dartez Ct | $399,900 | $239 | 2026-06-18 | 2026 | 1,670 |
| Landon Hills | 8377 Bull Headley Rd | $462,900 | $215 | 2026-06-18 | 2026 | 2,149 |
| Conservation Of Summerbrooke | 1463 Summerbrooke Dr | $568,900 | $277 | 2026-06-18 | 2025 | 2,055 |
| None | 4520 Garden Oaks Way | $424,900 | $190 | 2026-06-18 | 2025 | 2,239 |
| Canopy | 3825 Ardmore Ln | $580,000 | $252 | 2026-06-17 | 2025 | 2,302 |
| Fallschase | 360 Bienville Pl | $537,000 | $209 | 2026-06-17 | 2025 | 2,572 |
| Pine Dove Estates | Peace Dove Trl | $564,900 | $195 | 2026-06-17 | 2026 | 2,890 |
| Olson Ridge | 2909 Ervine St | $460,000 | $180 | 2026-06-16 | 2025 | 2,550 |
| Pine Dove Estates | 5370 Pine Dove Dr | $564,900 | $195 | 2026-06-16 | 2026 | 2,890 |
| Golden Eagle Plantation | 2875 Royal Isle Dr | $1,479,400 | $379 | 2026-06-12 | 2026 | 3,900 |
| Hammock At Oak Grove | 8419 Knotted Pine Ln | $579,400 | $272 | 2026-06-12 | 2025 | 2,130 |
| Hartsfield Hills | 1632 San Damian Rd | $499,000 | $257 | 2026-06-12 | 2025 | 1,939 |
| Reserve At Rivers Landing | 4909 Sampler Dr | $309,500 | $224 | 2026-06-09 | 2026 | 1,382 |
| Fallschase | 4248 Landry Ln | $446,700 | $283 | 2026-06-08 | 2026 | 1,580 |
| Conservation Of Summerbrooke | 1427 Summerbrooke Dr | $639,000 | $269 | 2026-06-08 | 2025 | 2,378 |
| Conservation Of Summerbrooke | 1443 Summerbrooke Dr | $618,400 | $260 | 2026-06-05 | 2025 | 2,378 |
| Canopy | 2347 Briar Rose Gln | $331,200 | $259 | 2026-06-03 | 2025 | 1,280 |
Joe's US Housing Reports




Fannie Mae Report: It's The TRUTH About The Housing Market

Real Estate Meltdown: Starter Homes at $1M in 233 Cities

Is the Housing Market Crashing? | Redfin April 2025 Update

Is This The CALM Before The CRASH? Volatility Rocks Housing