 The Tallahassee Real Estate Blog’s primary focus is on the Tallahassee real estate market, specifically residential sales in Leon County, Florida. But today we’re going to broaden the scope of our report.
The Tallahassee area is comprised (roughly) of eight counties, or what I like to call Central-North Florida. We’ll look at average home prices, average home values, and average home sizes in each of these counties.
First, let’s take a look at what’s for sale today:
Homes For Sale In Central-North Florida
The following list includes all homes for sale in Central-North Florida. You can sort and refine the list by using the tools at the top-left of the list.
Homes For Sale In Central-North Florida



Average Home Prices In Central-North Florida
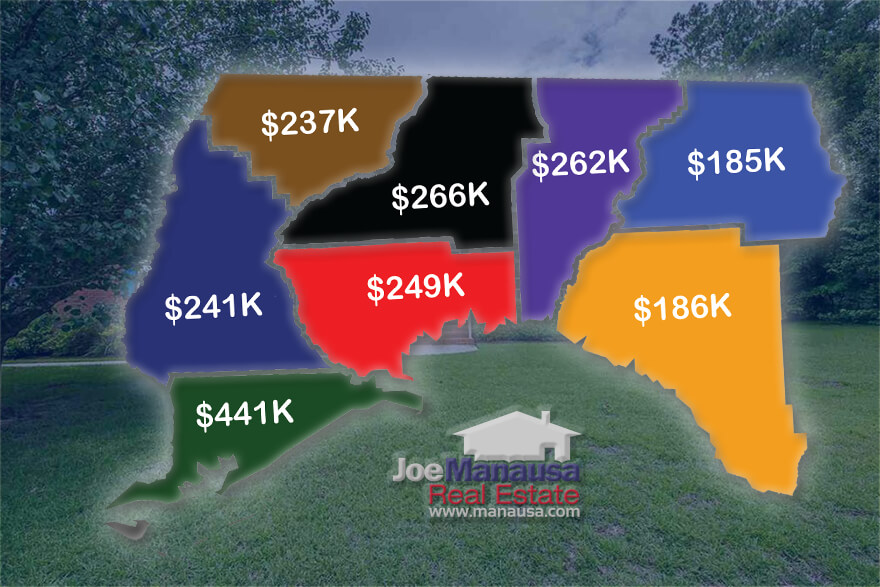
The first graph in today’s report shows the average home price in each county of the Central-North Florida housing market.

Home prices in our area are clearly on the rise, with the highest rate of growth reported in Franklin County. With relatively few sales coupled with the high-priced beach market, we find a good bit of volatility in the data for Franklin County. You can rest assured that home prices there did not fall last year, yet the average came down as fewer beach properties (relative to interior properties) sold in 2020 when compared to this year’s ratio.
The most stable line in the graph above belongs to Leon County due to the highest number of homes sold. One interesting note is that Wakulla County (red) has an average home price that is approaching the same as Leon County. For years this has not been the case, as many people went to Wakulla County to get “more home for the dollar.” But with a high number of new construction homes skewing the data higher, Wakulla County finds itself with an average home price of $249K this year.
Average Home Values In Central-North Florida
This graph shows the average home value (measured in price per square foot) in each county of the Central-North Florida housing market.

We track average home prices to see what buyers are paying for homes, but we track average home values to get a feel for appreciation in the housing market. Today, home values are rising everywhere.
 While it is obvious from the graph that average values are exploding in Franklin County, what’s not so obvious is the rate of value growth in the rest of the counties. The table on the right shows that the overall value growth (through five and one-half months in 2021) is 11% and is on pace to break 20% for the year!
While home values are exploding right here in Tallahassee, it turns out that Leon County is the slowest appreciating county of the eight in Cental-North Florida. Every other county is higher than Leon, from as “low” as 14% in Taylor and Wakulla Counties to as high as 47% in Liberty County!
The combination of a low inventory of homes for sale, coupled with high demand from low mortgage interest rates has home values exploding. Homebuilders in all 8 counties should see this and endeavor to build more homes.
Average Home Sizes In Central-North Florida
This graph shows the average home size (measured in heated and cooled square feet) in each county of the Central-North Florida housing market.

I like to include “size” graphs to help explain differences in prices and values. When all else is equal, smaller homes sell for a higher price per square foot (but a lower price) than do larger homes. If the average home size is falling, we often see an abnormally large rise in home values.
From the volatility in Liberty County, we can tell that there are not many home sales reported in our MLS, thus we can also assume its 47% appreciation rate is not a valid measurement. So let’s take a quick look at the number of home sales in each county thus far in 2021.
Home Sales In Central North Florida
This graph shows the number of homes sold from January through May in each year from 2006 through 2021. The total for Leon County has been divided by 10 in order to preserve the scale of the graph for the other counties.
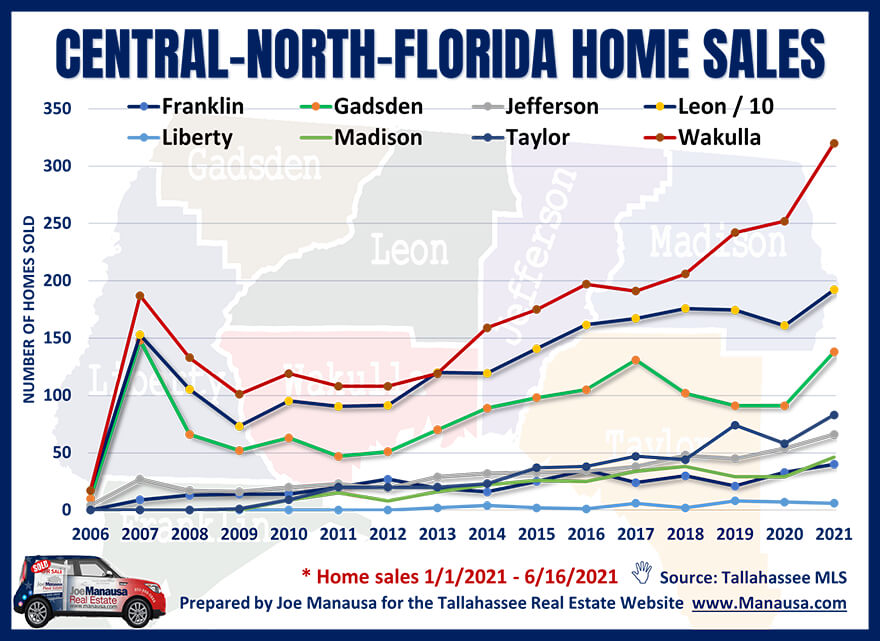
Home sales in all but Liberty County are on the rise, with the area reporting 23% more homes sold through May than were reported through May in 2020. Madison County is reporting 59% growth, Gadsden County 52% growth, and Taylor County shows 43% growth. Home sales grew 19% in Leon County and 27% in Wakulla County. Some of this heightened growth is due to the fact that April and May of 2020 had lower numbers due to COVID, but sales are still up significantly over 2019 figures as well.
In order to see everything in perspective, I have included a table below that shows all the graph data together.
Central-North Florida Summary
This table summarizes housing data for each county of the Central-North Florida housing market.

The first number that jumps out at me is the 1,922 homes sold in Leon County represent 73% of all sales in the eight-county area. The number of sales in Liberty, Franklin, Madison, Jefferson, and Taylor counties is too few to form any strong opinions on the averages reported.
Perhaps the number that might surprise you the most is that the average price per square foot of homes in Wakulla County is now higher than those in Leon County. This happened once in the past, in 2011, as Leon County home values fell hard during the recovery (earlier than did Wakulla County).
I hope you enjoyed the update on home sales in Central-North Florida, please let us know if we can help you sell or buy a home today.
Top Hombuyer Tips

Buy Now Or Wait? The 91.6% Rule
Biased Results? The New York Times Rent Or Buy Calculator

Do's And Don'ts During The Home Loan Process

6 Real Estate Contract Terms You Should Not Overlook

7 Tips On Buying A Home With A Pool
How much house can you actually afford (By Income)?

What Does "Marry The House Date The Rate" Mean In Real Estate?

Why Fixer Uppers Are the New Gold | Home Renovation Guide