Are ‘High’ Mortgage Rates Really That High?
Let’s start with the first and most common claim you’ve probably seen: “Today’s higher mortgage rates are really to blame for falling demand?
Let’s focus on the numbers behind today’s mortgage rates and why so many YouTube analysts frame them as a crisis.

Over the past few years, the story has been everywhere: mortgage rates have shot up, and buyers are getting priced out. If you look at a graph covering just the last seven years, it’s easy to see why people are alarmed. Between 2018 and 2021, rates dropped to record lows, bottoming out at 2.65% and rarely climbing above 4%. Now, with rates hovering near 7%, it’s understandable that buyers who missed the low point feel like they’re facing an uphill battle. But this focus on recent history leaves out crucial context, and that’s where the narrative starts to break down.
It’s important to remember that using a short-term lens only tells part of the story.

When you zoom out and examine mortgage rates since 1971, a very different pattern appears. Over the past 50 years, the average 30-year fixed mortgage rate has been much higher than what we see today. In the 1980s, for example, rates regularly exceeded 16%, peaking at a staggering 18.45%. Even through most of the 1990s and early 2000s, 7% seemed like a great deal. In fact, today’s 7% sits about 10 percentage points below the 50-year average of roughly 7.71%. So while the jump from the pandemic-era lows feels dramatic, it’s not historically out of line.
That said, I’m not dismissing the real pain buyers feel in this market. Home prices have climbed, and when you combine higher prices with 7% rates, affordability becomes a real issue. But it’s not the interest rate alone causing the squeeze. The real challenge is the ongoing shortage of homes for sale. The focus on “sky-high” rates distracts from the deeper problem: there simply aren’t enough homes on the market to meet demand, especially at the entry level.
Now, for those of you who locked in a rate below 5%, drop a comment and let us know what your rate is and how you feel about today’s 7%. I’m always interested in hearing your perspective.
Now that we’ve reset our rate expectations, let’s look at who actually qualifies for these mortgages—and why the bottom 10% have been shut out since 2010, and the unforeseen impact of this effect.
Keep Up With New Trends In Tallahassee!
Get The Tallahassee Real Estate Newsletter
 Don't be the one that doesn't know what's going on when you sell a home or buy a home in Tallahassee.
Other buyers, sellers, lenders, and real estate agents have this critical information, and now you can too!
Get immediate access to our most recent newsletter.
Let more than 30 years of experience work for you with charts, graphs, and analysis of the Tallahassee housing market.
The Hidden Impact of the Dodd-Frank Act on Homebuyers
This is where the conversation shifts from the rates themselves to the rules that determine who can even get approved.

The landscape changed dramatically after the last housing crash, and the effects are still shaping the market today.
Understanding how these changes have sidelined a significant portion of would-be buyers is critical to making sense of today’s affordability crisis. The next metric reveals why, for many, it’s not just about whether you can afford a mortgage—it’s about whether you can get one at all.
Let’s talk about a policy shift that changed the landscape for homebuyers: the Dodd-Frank Act. Following the 2008 housing crash, lending standards were tightened across the board. One result stands out: a 13-year void of over 8 million starter homes. That single policy change didn’t just keep risky lending in check; it also kept a huge segment of buyers, especially those with lower credit scores, locked out of the market.

In the 1990s, it wasn’t unusual for lenders to approve borrowers with credit scores near 590. After the Dodd-Frank Act, most lenders raised their minimum credit scores to 620 or even 640.
That shift, while seemingly making the system safer, meant millions of would-be buyers could no longer qualify for a mortgage. Builders noticed. With fewer people able to buy entry-level homes, demand for starter homes dropped, and so did the incentive to build them.
Builders, seeing a smaller pool of qualified buyers at the lower end, shifted their focus upmarket. Instead of producing affordable homes, they started prioritizing higher-margin properties in the middle and upper price ranges. The economics were simple: with land, labor, and material costs rising, building entry-level homes made less financial sense. The result?
Fewer options for first-time buyers and a market that became increasingly difficult to enter for anyone not already on the property ladder.

So, builder production has been on the rise over the past 15 years, but not for affordable housing.
Despite recent headlines about a surge in new construction—nearly 1.7 million homes built last year—we’re still falling short.

The long-term average for new builds was approximately 1.5 million per year before 2008. Since 2010, we’ve averaged almost half a million fewer homes per year, resulting in that 8-million-home deficit. Even with today’s uptick, builders are still playing catch-up from years of underbuilding, especially at the affordable end of the market.
This isn’t just a numbers game. The shortage of starter homes affects the entire housing cycle. First-time buyers often struggle to find affordable options, which can lead to them staying renters for longer. That means move-up buyers have fewer prospects to sell to, slowing the entire chain of transactions. It clogs the system, making it harder for families to move up, downsize, or relocate as their needs change. Every missed opportunity for a first-time purchase is a missed opportunity for the whole market.
In addition to the credit and policy hurdles, economic pressures have made building affordable homes even more challenging. Land prices have soared in many regions, and the cost of permits and regulatory compliance keeps climbing. Labor shortages and higher material costs exacerbate the challenge. For most builders, the math just doesn’t work out for sub-$200,000 homes, so they follow the money and focus on higher price points. The gap at the entry-level continues to widen, leaving lower-income buyers with very few choices.
So when you hear claims about a looming oversupply, it’s important to look at the full picture. Yes, construction has increased, but it’s still nowhere near enough to erase more than a decade of lost inventory. The deficit in starter homes continues to shape the entire market, and catching up will take years of consistent building, especially at the affordable end.
New construction isn’t the oversupply boogeyman some make it out to be. It’s more of a slow, necessary catch-up. But if you’re hoping that existing home inventory might be the answer, it’s worth taking a closer look at what’s really happening there.




Fannie Mae Report: It's The TRUTH About The Housing Market

Real Estate Meltdown: Starter Homes at $1M in 233 Cities

Is the Housing Market Crashing? | Redfin April 2025 Update

Is This The CALM Before The CRASH? Volatility Rocks Housing

Warning Signs For Home Buyers And Sellers
It Always Comes Down To Supply And Demand
I’m seeing reports from all over that the US housing market has shifted from a seller’s market to a buyer’s market, but is that really true?
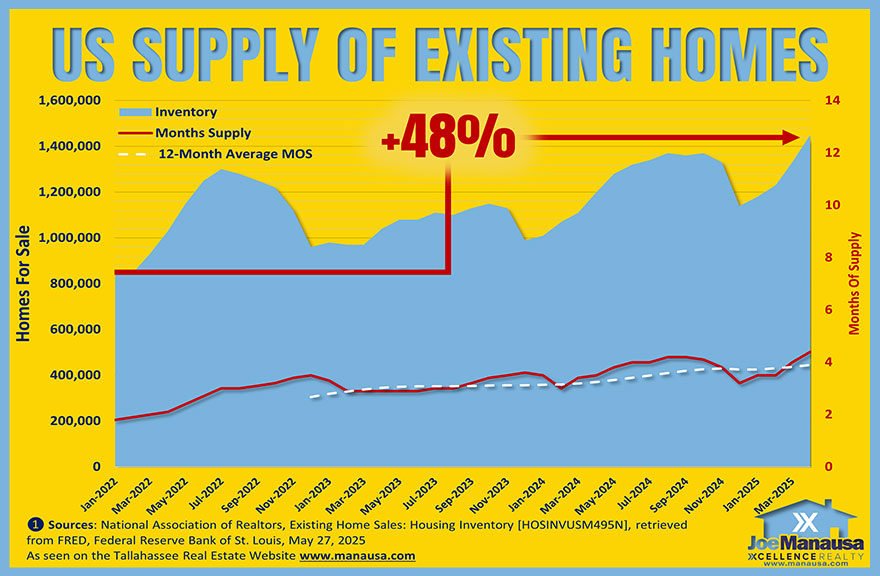
When we examine the evidence provided by the alarmists, it appears shocking. The supply of homes for sale has exploded since January of 2022, with the number of available listings up 48%, surpassing the 1.4M homes level. Surely this has flipped the market, right?

However, when we zoom out to consider the US housing stock in context, we find that we’ve merely bounced off an all-time low number of homes for sale.
When the housing market crashed in 2008, inventory levels jumped from the 1990s average of just over 2 million homes available, surging above 4 million homes. Simultaneously, Dodd-Frank raised the floor on home loans, removing 10% of the buyers from the market. Dodd-Frank did not cause the housing market crash, but it did create the low-inventory environment that has contributed to the current home affordability crisis.
So we’ve provided the context to show you how the supply data is being manipulated today, let’s hit the fifth key metric that creates wonderful clickbait, as long as the analyst produces figures without the context of history.




Housing Crash or Boom? Here’s What’s Coming in 2025
BIGGEST Housing Market Myth EXPOSED by New Foreclosure Data
Mortgage Delinquencies Forecast Foreclosure Sales Activity
You’ve seen “Foreclosure tsunami incoming” headlines, so why aren’t we drowning in cheap homes? We can examine current mortgage delinquency rates and observe that they are elevated; therefore, shouldn’t we expect foreclosures to be increasing soon?

Rising delinquency rates get a lot of attention, with some claiming they signal a repeat of 2009. Right now, there are 223,000 active foreclosures in the U.S., still near historic lows.
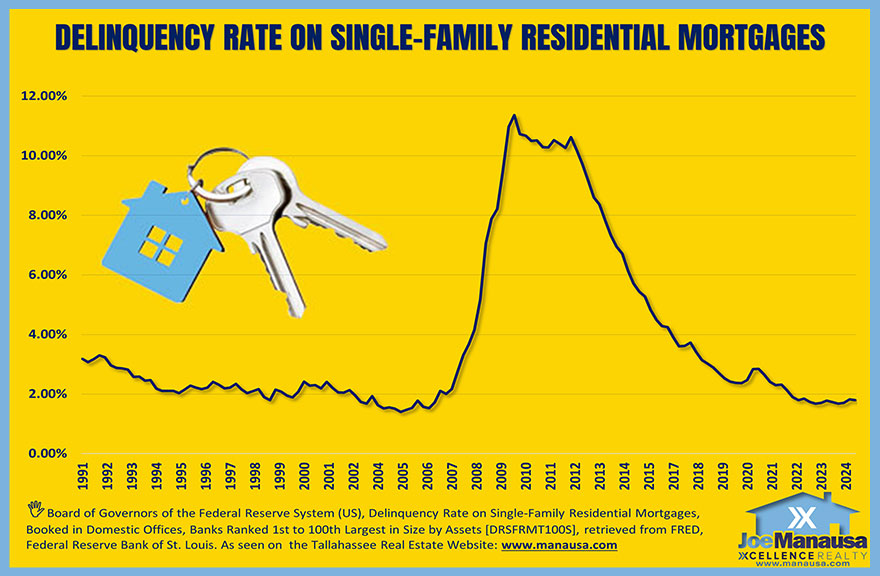
When we consider the delinquency rate in context, we should feel extremely confident that there will be no foreclosure crisis forthcoming. Remember, delinquencies today won’t show up as foreclosures for months or years, so there is no immediate threat. Furthermore, today’s rate is lower than it was at any point in the 1990s, and we certainly did not experience a crisis during that decade.
To recap: delinquency rates are below normal by historic standards, credit rules are much tighter, new builds are catching up, not overshooting, inventories remain lean, and foreclosures are still low.
So, how do you stop the spin before it hooks you? It’s simple. Whenever someone makes a bold statement, verify the source and then examine it through the lens of history. Sure, inventories are rising, and so are delinquencies. They had too, as both were sitting at all-time lows.
Do not let the fear-mongering reports skew your ability to rely on facts and data; everything we need to know is in the numbers, with context.
If you want to dig deeper into the foreclosure numbers and see seven more reasons that no foreclosure crisis is brewing, check out my recent video based on data sourced from the ICE Mortgage Monitor.