

Weekly Special | March 18, 2019
How Home Values Have Moved Over Past 12 Years
Home values in Tallahassee peaked in October of 2006, after which they proceeded to fall for nearly six straight years. The bottom of the market was finally established in April of 2012.
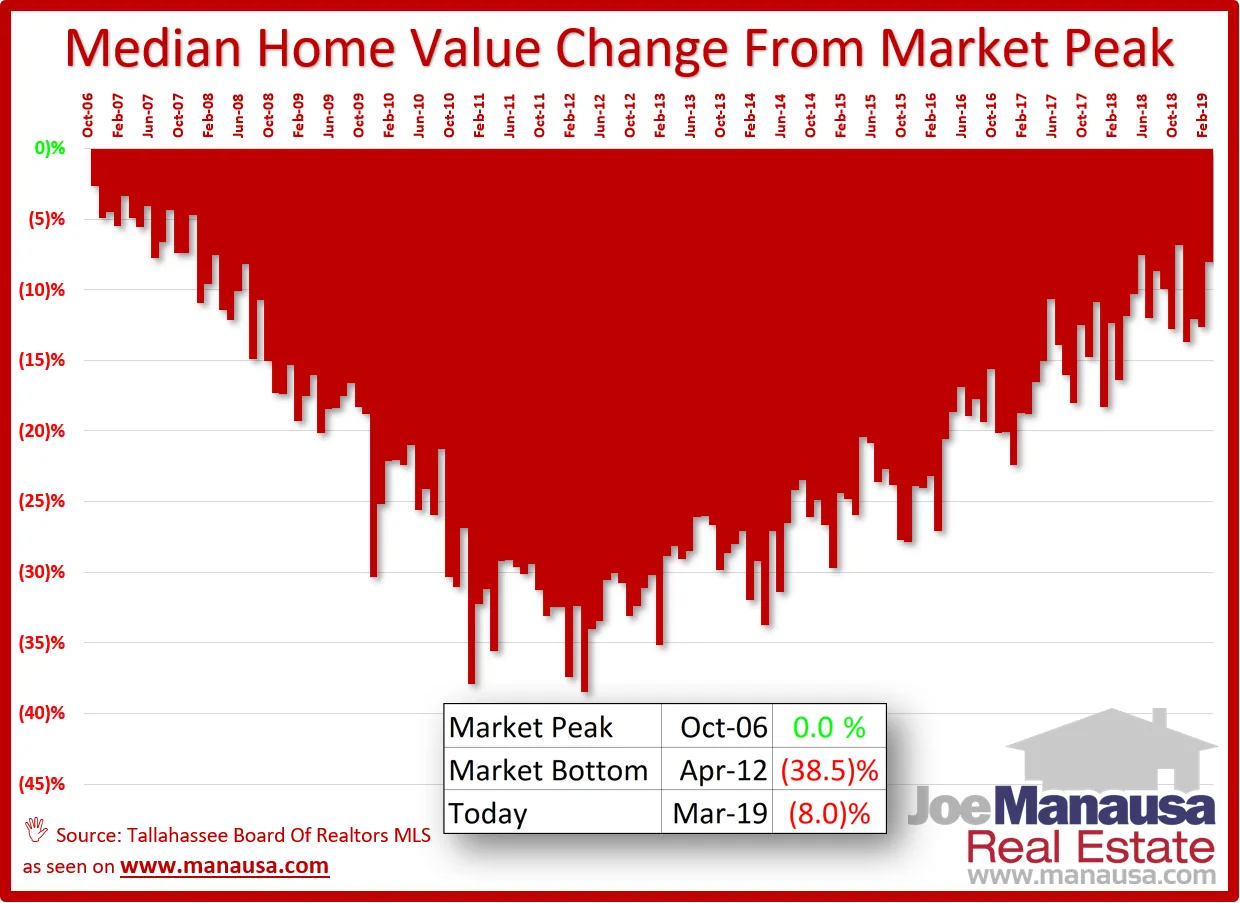
The graph above plots the percentage change in home values compared to the market peak in October 2006. When you look to the far left of the graph, you see “0%” (meaning no change) in October 2006, but values begin to decline significantly as you move right.
Currently, the median home value is 8% below the peak, meaning the middle of the market today ($127 per square foot) is 8% lower than median home values in October 2006 ($138 per square foot).
The Next Market Peak I believe the next market high is not too far off, as our current low inventory coupled with high demand will continue to push home values higher.
The median value (cost) of new construction homes is more than $170 per square foot, so the new inventory coming into the market is only going to pull median values higher. The need for more inventory could see new construction accelerate appreciation rates for the foreseeable future.
Based upon everything I’m seeing, I suspect Tallahassee will hit a new market high in median home values in 2020, though a change in mortgage interest rates could move the needle. If rates decline significantly due to Brexit, a new high could be reached this year. If rates head in the opposite direction, it could push the new high into 2021.
The original one-page Weekly Special PDF is still available.
Get the Weekly Special Every Monday
Each Monday morning the Weekly Special takes one Tallahassee housing question, answers it with a chart of local sales, and explains what it means for your next move.
It is free, and you can unsubscribe any time.