
Weekly Special | March 25, 2019
Plotting When Homes Sell During The Year
Seasonality occurs in most real estate markets, but its impact varies greatly. In Tallahassee, roughly 60% of the homes sell during the months of March through August, while 40% sell from September through February.
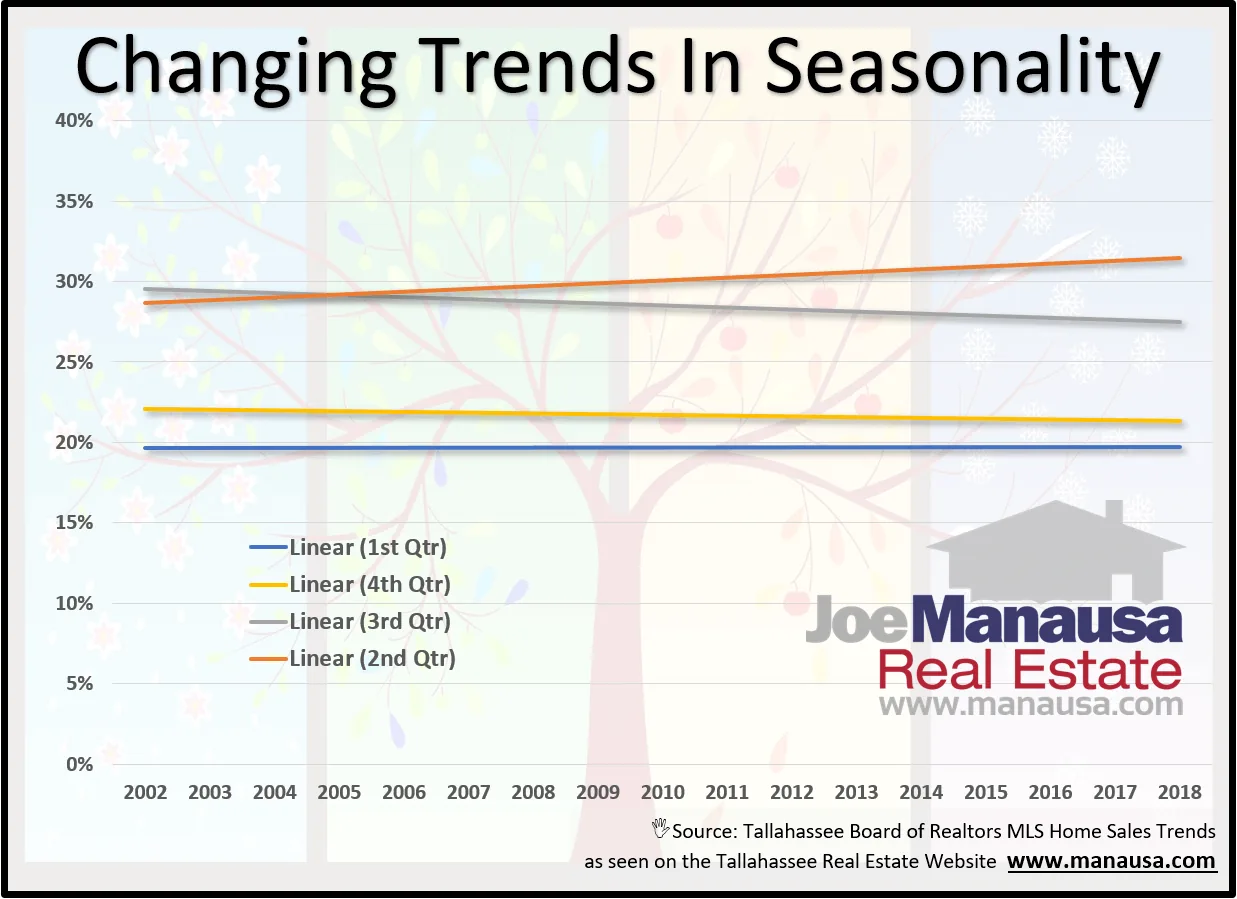
But this is only a generalization of when homes sell. I have been noticing some of my age-old rules of thumb changing, so I decided to plot the last seventeen years of home sales to identify emerging trends.
I’ve broken down all home sales in the Tallahassee MLS by date they closed and grouped all dates into quarters and years. Each quarter is plotted as a linear trend from left to right, meaning we can see how much of the market closed each quarter over the years.
For example, the orange line shows that the second quarter of each year is the most active, and we’ve seen it move from roughly 28% of annual home sales to 32% of home sales.
Conversely, the first quarter has not really moved at all, averaging just less than 20% of the home sales each year.
Over the past 17 years, we observe the following trends: 3rd and 4th quarter home sales represent less of all home sales than they did in the past. 2nd quarter home sales represent nearly a third of all home sales annually. 1st quarter home sales represent about a fifth of all annual sales.
If you are thinking about selling a home sometime soon, give us a call to learn how seasonal trends might impact you.
The original one-page Weekly Special PDF is still available.
Get the Weekly Special Every Monday
Each Monday morning the Weekly Special takes one Tallahassee housing question, answers it with a chart of local sales, and explains what it means for your next move.
It is free, and you can unsubscribe any time.