Every time you hear that Tallahassee home prices hit another high, a second thought follows close behind. Groceries cost more too. So does car insurance, and so does the plumber. If your home only kept pace with everything else, the bigger number on paper buys you nothing extra when you sell one home and buy the next.
If homes did pull ahead, a second question follows: who comes out ahead, and who pays? The owner who bought years ago, the renter who never bought and the young buyer trying to get in today all live with the same numbers, and they feel them in very different ways.
My team went back to 1991 and studied the open-market sales of existing single-family homes in Leon County in every year since. We started with price, then looked at the size and age of the homes that sold, what the monthly payment takes from a paycheck, and whether buying beat renting. Here is what those sales say about your money.
Table of Contents
Table of Contents
What We Found
- Homes beat everyday costs. Even after 10% selling costs, the median 1991 sale price grew about 1.9 points a year faster than prices outside housing. That built real wealth for owners and made buying harder for renters and first-time buyers.
- The homes got about 8% larger. The median size of the homes sold grew about 130 square feet in 34 years.
- The homes got much older. In the early 1990s, about 35 of every 100 existing homes sold were under 10 years old. In the last five years, fewer than 8 were.
- The payment takes more of the paycheck. The loan payment on the median sale price took just 20% of median household income in 1991, while in 2024, that number soared to 31.5%.
- Buying beat renting in almost every year. A buyer who paid the median sale price in any year from 1991 through 2021 and sold in 2025 came out ahead of a renter. Only buyers in the three most recent years, 2022 to 2024, would have done better renting. That matches my usual advice: plan on staying in a home at least 3 to 5 years, and 5 or more in today’s market, long enough to cover closing costs and start building equity.
Did Tallahassee Home Prices Beat Inflation?
Here is how we tested it. Take the median sale price from 1991, grow it with inflation every year since, and set it beside what homes actually sold for. For inflation, we use consumer prices without housing costs, so we never measure home prices against themselves.
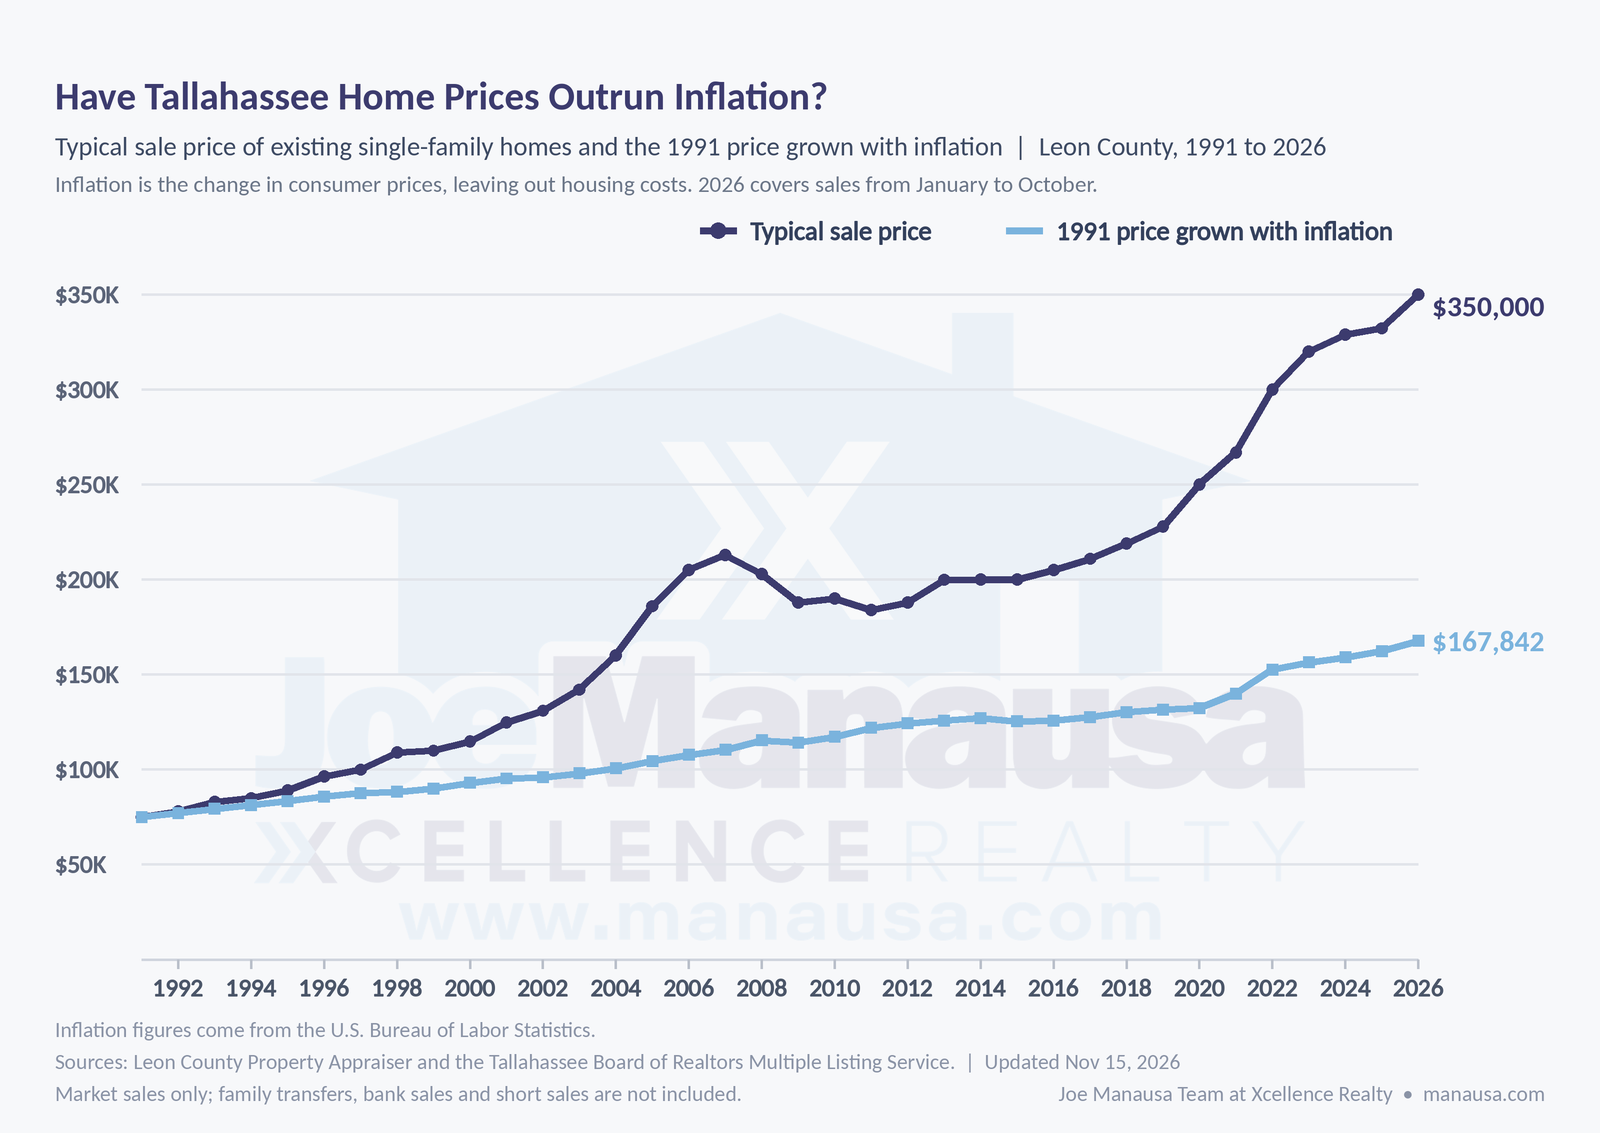
In 1991, the median sale price of an existing single-family home in Leon County was $75,000. In 2025, it was $332,300, and so far in 2026 it is $350,000. What counts is what an owner keeps, so we took 10% off the 2025 price for the cost of selling. Even then, the median sale price grew an average of 4.2% a year, while prices outside housing grew 2.3% a year.
That puts Tallahassee home prices about 1.9 points a year ahead of everyday costs, on average, for 34 years. For an owner, that edge is equity that grew faster than the cost of living, equity you can put toward your next home. For a renter, the same gap shows up as rent that keeps rising while no equity builds. For a first-time buyer, it means home prices have outpaced the paychecks they’re saving to buy one.
Why would homes outrun everything else for so long? I think of housing as a food chain. Every place a person can live, from an apartment or a mobile home to a large single-family home, competes for the same households. When any level of that chain is underbuilt, buyers and renters compete harder for what exists, and rents and prices get pushed up the chain.
Tallahassee didn’t build enough homes to keep up with demand. You can see it in what people pay. From 1991 to 2025, the median sale price grew to more than four times its 1991 level and the fair market rent for a three-bedroom Leon County home roughly tripled, while everyday prices a little more than doubled. Leon County built about 1,500 single-family homes a year in the 1990s (counting townhomes and condos), and about 525 a year since 2011, roughly a third of the old pace. You can see the long view of local home values in our history of Tallahassee home values, and our look at Tallahassee mortgage rates explains why the payment has climbed even as rates settled.
Each year’s median sale price comes from a different set of homes, but you own just one house. So we followed the same houses from 1991 to 2025. We found 8 Tallahassee homes that sold near the middle of the market in 1991 and sold again in 2025, with no sign of added space or major remodeling. Their prices rose a median of 292% over 34 years, a little slower than the 343% rise in the median sale price.
Even so, after inflation those 8 homes still gained about 81% in total. In 2025, 7 of the 8 sold for less than that year’s median sale price, so homes that sat in the middle of the market in 1991 now sit a little below it. The 8 homes we followed gained less than the median sale price but still finished far ahead of everyday prices, which roughly doubled. That raises the next question: did prices climb because buyers got more house?
Are Tallahassee Home Prices Buying a Bigger House?
If today’s homes were much bigger, a higher price would simply buy more house. This chart shows the median living area of the existing homes sold each year, with a dashed line for the long-term trend.
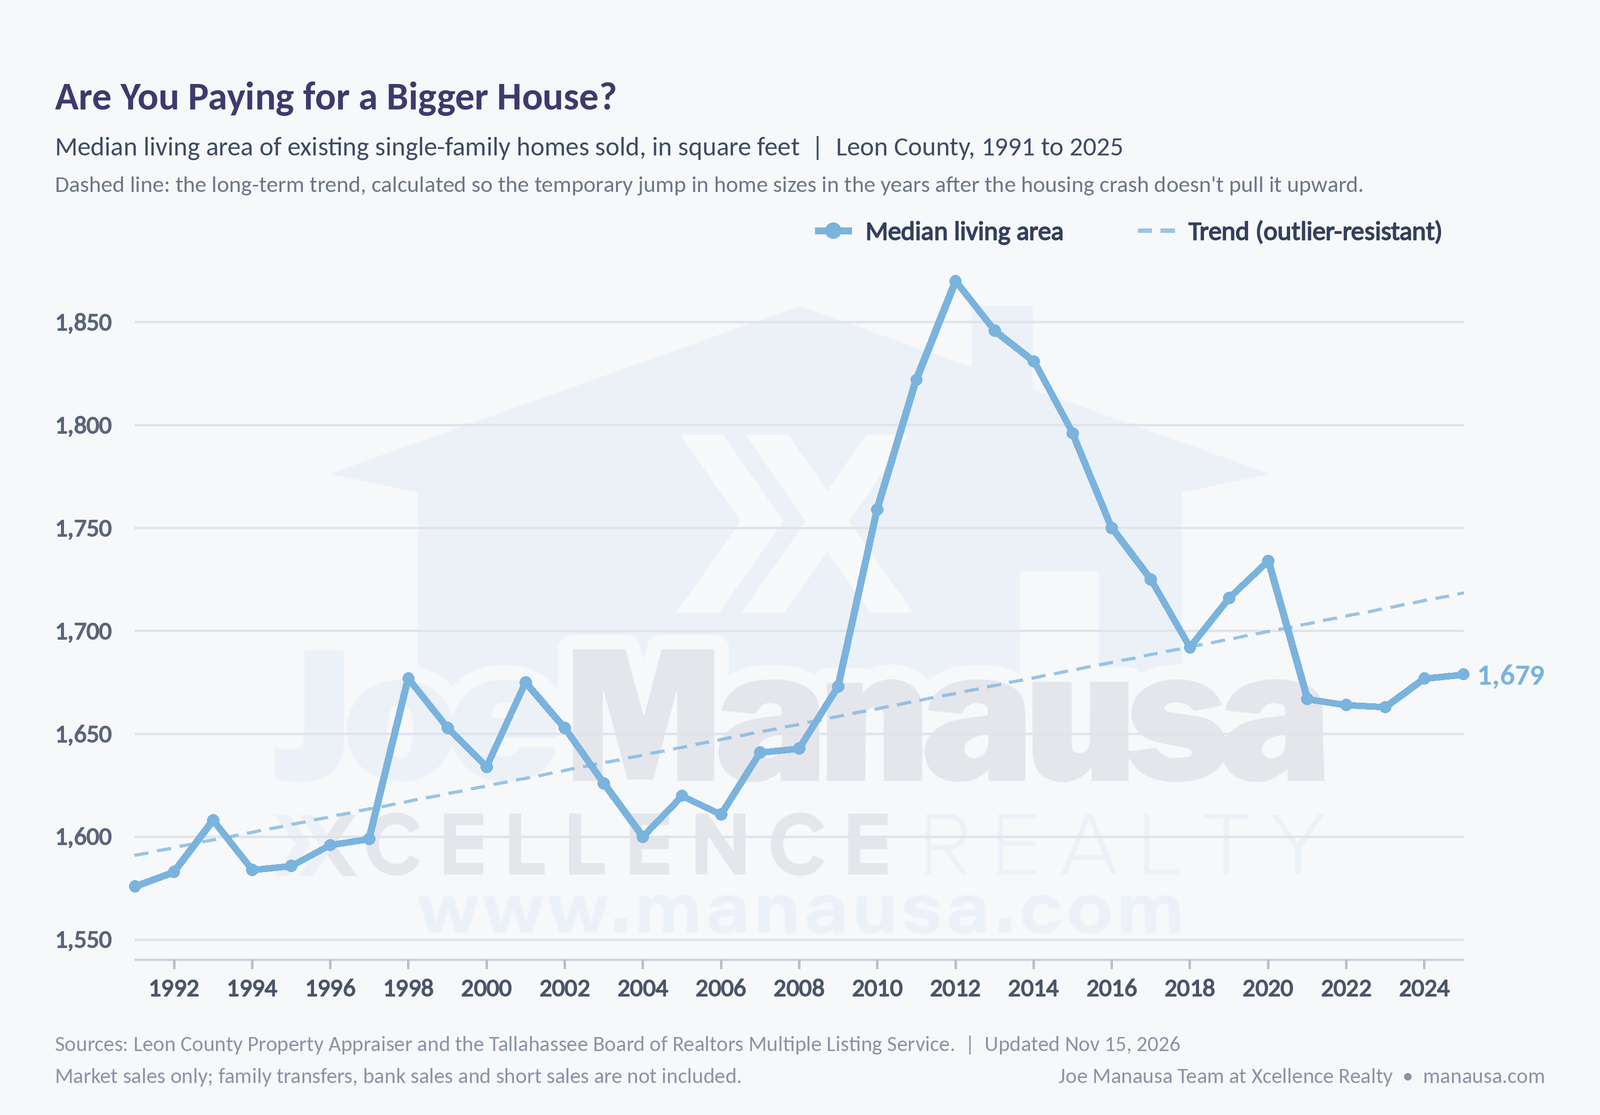
The median size of the homes sold grew about 130 square feet from 1991 to 2025 (100 to 150, depending on how you draw the trend line), roughly 8% more house.
The rise in the middle of the chart was real. In the years after the housing crash, the median size of the homes sold climbed to 1,870 square feet in 2012, then settled back to 1,679 by 2025. We drew the dashed trend line so those few unusual years don’t inflate the long-term gain.
So size explains only a small part of the price. Tallahassee home prices rose 343% from 1991 to 2025 while the median size of the homes sold grew about 8%, and the same 8 houses above rose 292% with no sign of added space or major remodeling. If you are buying, you are paying more than four times what a 1991 buyer paid for about 8% more house.
You can compare more recent sizes and prices in our report on Leon County home prices and values. The homes sold got about 8% larger, and they got much older.
Where Did Tallahassee’s Newer Homes Go?
In 1991, the median age of an existing home at sale was 13 years. In 2025, it was 38 years. A big part of the reason shows up in this chart: the share of existing-home sales that were less than 10 years old.
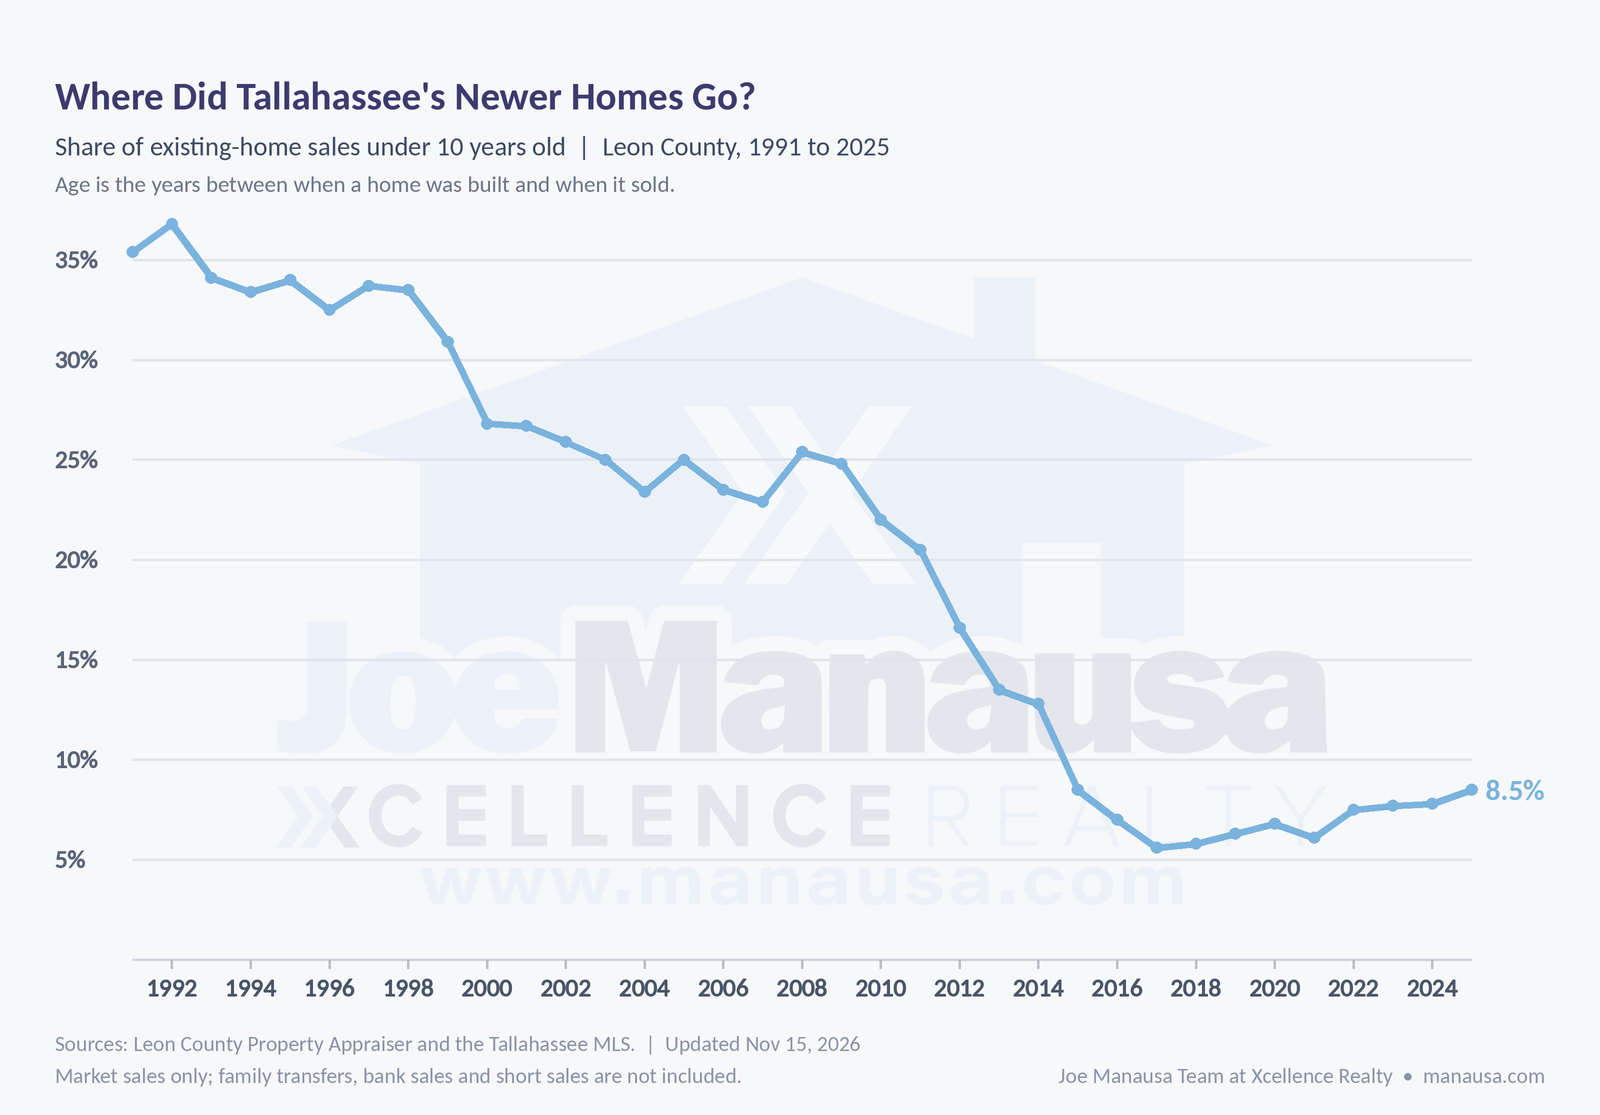
In the early 1990s, about 35 of every 100 existing homes sold were less than 10 years old. Over the last five years, fewer than 8 of every 100 were. Near-new homes have mostly disappeared from the existing-home market.
Declining new construction is the likely reason. When builders added about 1,500 single-family homes a year, a steady stream of them came back to market a few years later as existing homes. At about 525 a year, that stream is much thinner, so the existing homes sold today are older.
That matters on both sides of a sale. Today’s Tallahassee buyer pays more than four times the 1991 price for a home that is 25 years older at sale. Before you make an offer, take a close look at the roof, heating and cooling, plumbing, and the cost of insuring an older home. As a seller, you compete on condition, and the updates you have made are what set your home apart from the many others its age.
Price, size and age tell you about the house. The monthly payment tells you what it costs to live in it.
How Much of Your Paycheck Does a Home Take?
This chart shows the monthly loan payment on each year’s median sale price, with 20% down and a 30-year fixed rate at that year’s average, as a share of median household income in Leon County.
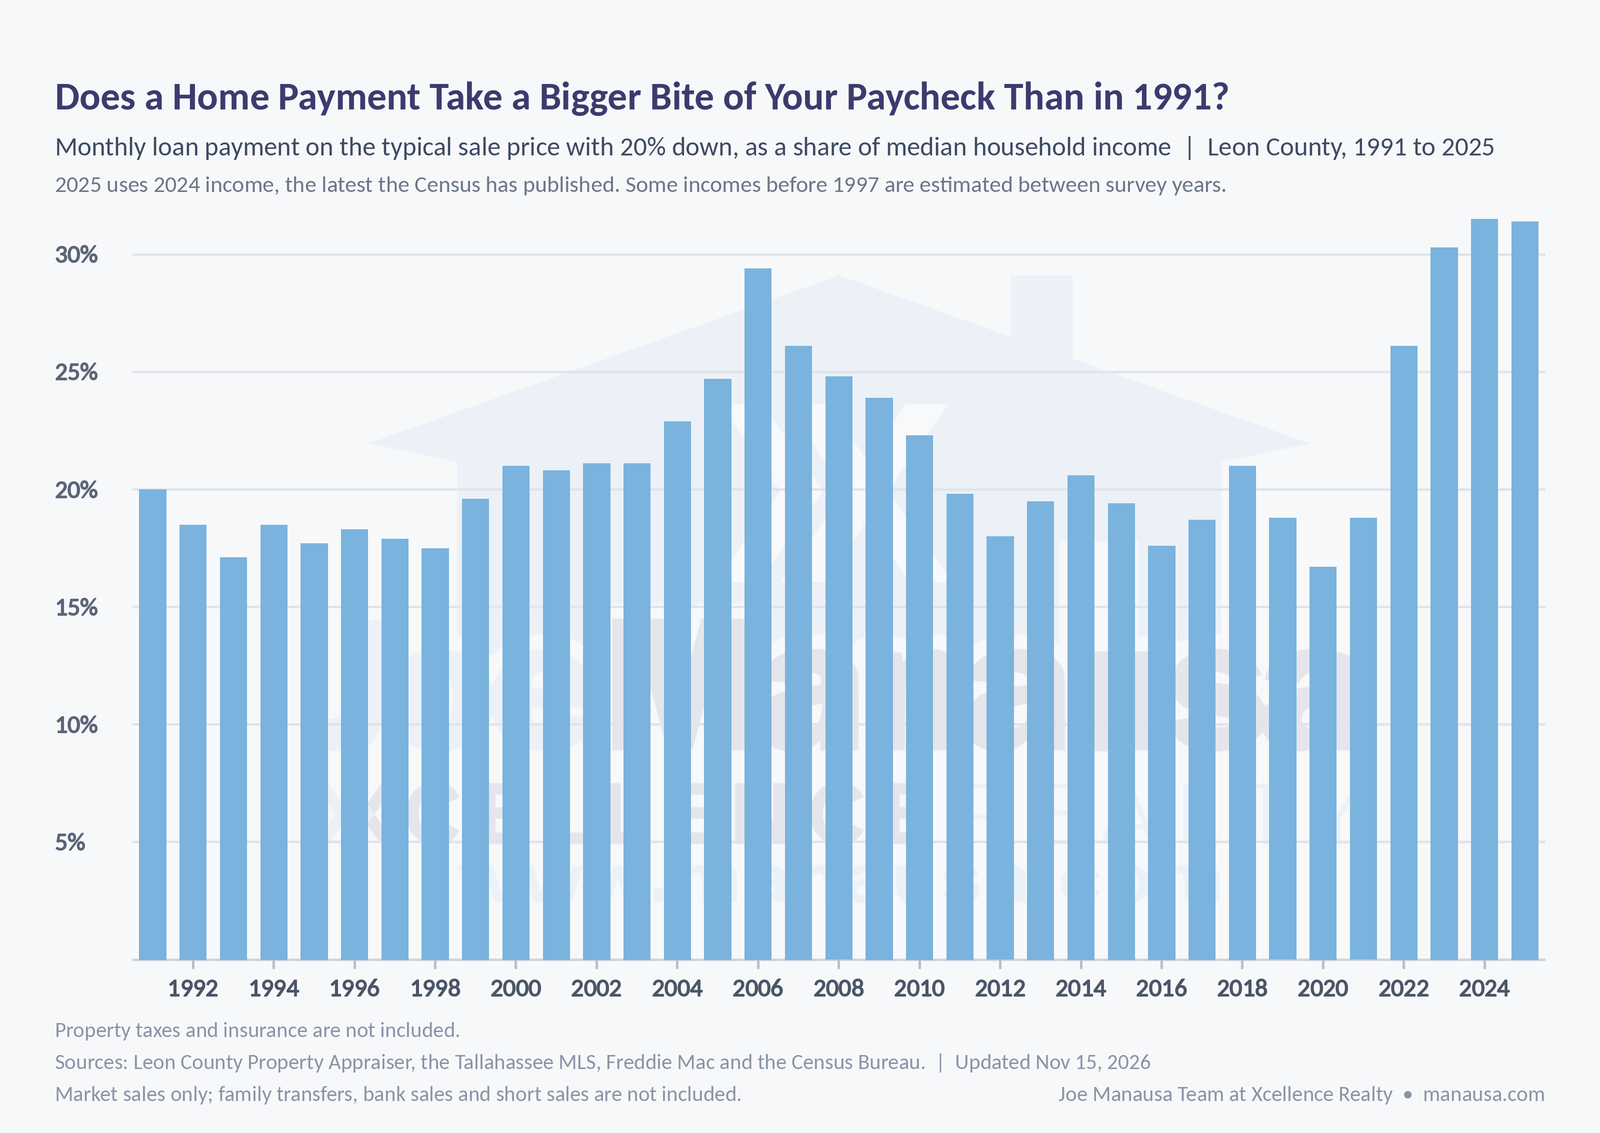
In 1991, the loan payment was $493 a month at a 9.25% rate, and it took 20% of household income. In 2024, it was $1,702 a month at 6.72%, and it took 31.5%. That is nearly 12 more dollars of every 100 a household earns going to the same kind of home.
After inflation, median household income in Leon County was only about 3% higher in 2024 than in 1991. That is 3% in total over 33 years, not 3% a year. Tallahassee home prices grew far faster, so the payment now takes a much bigger share of income. We looked at the race between wages and home prices before, and the gap between them has widened since 1991.
Rates are actually lower today than in 1991. At 1991’s rate, the payment on a 2024 home would take about 40% of household income. If you are buying, your monthly payment decides how much home you can afford. That is why planning a Tallahassee home purchase starts with the monthly number. If you are selling, your buyer is stretching more of their paycheck than buyers did a generation ago, so they have less room to pay above market value, and pricing at market value from the first day matters more.
That raises a fair question. Was buying still worth it, or would renting have left you better off?
Did Buying a Tallahassee Home Beat Renting?
To answer it, we compared two people for every year from 1991 to 2024. One buys at that year’s median sale price and sells in 2025. The other rents a similar home. The renter keeps the money a buyer would have spent on the down payment and closing costs, and it earns a safe rate of about 3.3% a year.
The owner puts 20% down, pays 3% to buy and 10% to sell, and spends 1% to 2% of the home’s value a year on upkeep, more as the home ages. The renter pays the median rent for a home like the median home sold.
That is not the median rent in Tallahassee. About 6 of every 10 Leon County leases were for something other than a detached house, and the median rental is smaller than the median home sold. So we compared rent for homes like the median home sold: three-bedroom houses of about the same size. We used the same approach in our earlier look at whether to rent or buy in Tallahassee.
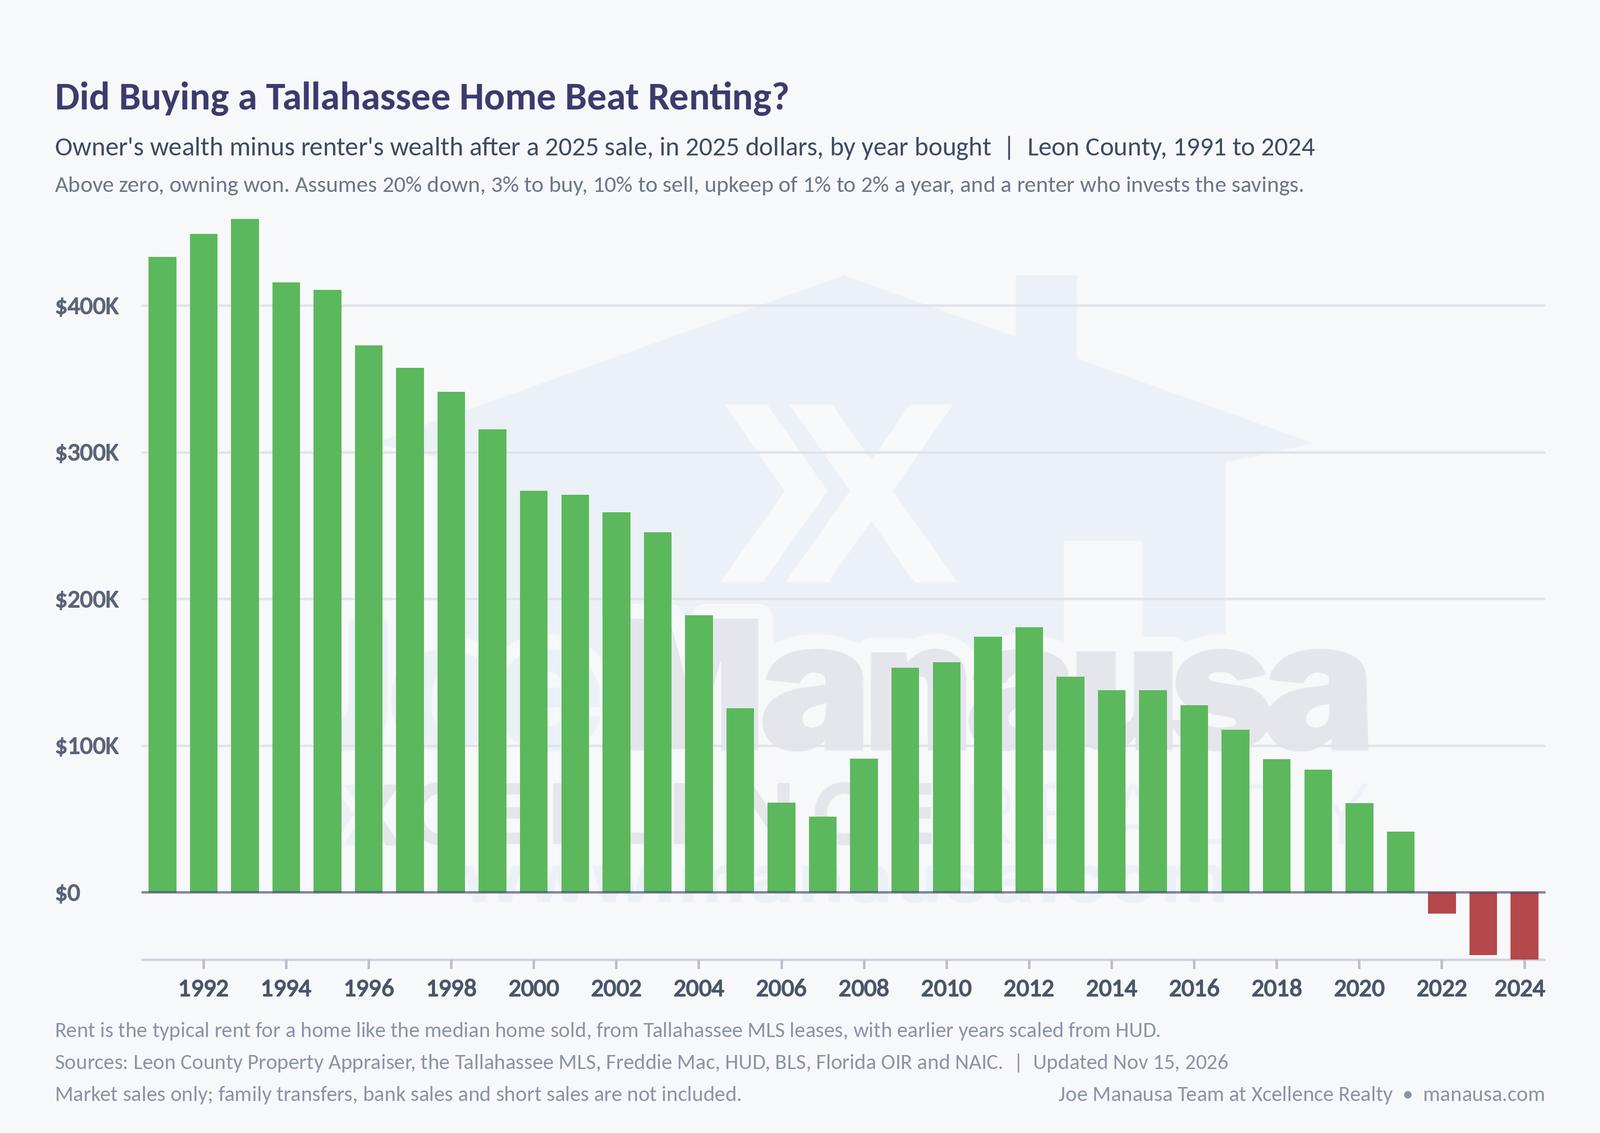
Green columns above zero show the years owning won, and red columns below zero show the years renting won. Owning won for 31 of the 34 purchase years, most of them by more than $100,000. A 1991 buyer who sold in 2025 came out about $433,000 ahead of the renter, in today’s dollars.
Even buyers in 2006 and 2007, just before the housing crash, came out about $61,000 and $51,000 ahead. A 2021 buyer, the last winning year, came out about $41,000 ahead. Only 2022, 2023 and 2024 buyers would have done better renting, by about $14,000, $42,000 and $46,000. Their homes did not lose value. They just haven’t owned them long enough to cover the closing costs of buying and selling. The median sale price was about $300,000 in 2022 and $332,300 in 2025, a gain that hasn’t yet paid for those costs.
Buyers pay about 3% to 4% to buy and 8% to 10% to sell, so a buyer has to earn back roughly 12% to 14% of the price before coming out ahead. At about 4% a year in appreciation, earning that back takes more than 3 years, which is why I usually tell buyers the break-even point is somewhere in the 3-to-5-year range. These buyers owned for three years or less.
Here is my advice. If you know you will stay more than 5 years, you will almost certainly do better financially by buying. If you know you will stay less than 3 years, you will likely do better by renting.
Between 3 and 5 years, the right answer depends on where the market is headed, and that is a good time to talk with a member of the Joe Manausa Team. In 2021, we told nearly everyone to buy, because we knew mortgage rates would likely never be that low again in their lifetime. Back then, we expected 3 years to be enough. The 2021 buyer, who has owned about 4 years, still came out ahead. Today, with buyers still recovering from the payment shock of higher rates, we lean strongly toward planning on 5 years or more.
It comes down to risk. A renter never builds equity with those monthly payments, but a renter also can never get stuck with a house worth less than what is owed on it. An owner has the chance to build real wealth. But if life forces a move soon after buying, the owner could lose the down payment and closing costs, and may even have to bring cash to the closing table to sell. Our look at homeownership as a hedge against inflation goes deeper on that trade-off.
What Does This Mean for Your Move?
So, have Tallahassee home prices really beaten inflation? Yes. Since 1991, home prices have grown about 1.9 points a year faster than everyday costs, even after the cost of selling. Over the same years, the homes grew about 8% and got much older.
If you own a home, that gap is real money you can put toward your next purchase. If you rent, it is why buying your first home keeps getting harder. If you are buying for the first time, the payment takes a bigger share of your paycheck than it did a generation ago, so check the income needed to buy a home in Tallahassee and know what a home is truly worth before you make an offer. To see whether today’s market favors buyers or sellers, read our latest report on whether Tallahassee still has a balanced market.
What Could Your Home Sell For?
Your home’s value depends on its own location, size and condition, not on county-wide figures. Enter your address to see what it could sell for today, based on recent sales of similar homes near you.
How We Measured It
- Sales: existing single-family homes sold in Leon County from 1991 through October 2026. Only market sales count, so we leave out family transfers, bank sales and short sales. We measure new construction separately and leave it out here.
- Inflation: the consumer price index for all items less shelter, as a yearly average, from the U.S. Bureau of Labor Statistics. The 1.9-point edge compares the 1991 price with the 2025 price after 10% selling costs.
- Size: heated living area from the Leon County Property Appraiser. The trend line uses a method that a run of unusual years can’t pull up or down.
- Same houses: homes that sold between the 45th and 55th percentile of 1991 prices and sold again on the open market in 2025, with no sign of added space or major remodeling.
- Home age: the years from construction to sale. New homes built: Leon County single-family homes, townhomes and condos still standing, by the year built, checked against U.S. Census Bureau building permits.
- Loan payment: 20% down and a 30-year fixed loan at each year’s average Freddie Mac rate, without property taxes or insurance.
- Income: median household income for Leon County from the U.S. Census Bureau, via the Federal Reserve Bank of St. Louis. For years without a published figure, including 1991, we estimate income from the years around them, and 2025 uses 2024 income.
- Rent versus own: from 2009 on, rent is the median Tallahassee MLS lease for a detached three-bedroom Leon County house within 20% of that year’s median size of homes sold. For 1991 to 2008, we scaled the HUD three-bedroom fair market rent by 1.276, the median ratio of the two from 2009 to 2025. With 4% down and 7% selling costs instead, the same three purchase years lose. Insurance follows the Florida Office of Insurance Regulation statewide average, as reported by Insurance Journal, and earlier Florida averages from the National Association of Insurance Commissioners. The owner’s costs include property taxes with the homestead cap. The renter’s savings earn inflation plus 1 point a year, and we leave income taxes out on both sides. Each year, whichever side paid less kept the difference, and it earned the same safe rate.
- Data updated November 15, 2026.
Get the Weekly Market Report
Each Monday our market report shows Tallahassee buyers, sellers and owners what the latest numbers mean for them. You can read past issues here.
 Weekly Market ReportThe Tallahassee numbers local agents watch, in your inbox every Monday.Free. Unsubscribe anytime. Privacy policy
We Are Here to Help
Whether you are deciding when to sell, what to offer or how much home your budget allows, the right agent starts with market value, not a guess. You do not have to be ready to move to ask a question, and you can get to know our agents long before you decide.
Related reading: the most affordable state capitals once you count taxes | how many Tallahassee buyers pay cash. More from our team: selling a home in Tallahassee, browse Leon County homes for sale, explore Tallahassee neighborhoods or learn about the Joe Manausa Team at Xcellence Realty.
Send our team a note with your address, and ask what similar homes near you have sold for.
Sources: the Tallahassee Board of Realtors Multiple Listing Service, Leon County Property Appraiser, U.S. Bureau of Labor Statistics, Freddie Mac, U.S. Census Bureau, Federal Reserve Bank of St. Louis, U.S. Department of Housing and Urban Development, Florida Office of Insurance Regulation.