
Tallahassee Housing Market Trends

Residential Sales Trends February 14, 2010
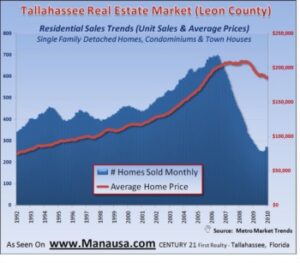
A Tallahassee home sales graph shows increasing unit sales and decreasing prices. We should see these trends continue until the market reaches equilibrium.
A Tallahassee home sales graph shows increasing unit sales and decreasing prices. We should see these trends continue until the market reaches equilibrium.

The Pending Home Sales Report is a good indicator of what we will see in the coming months in closed home sales.

After hitting a market bottom in August of 2009, the number of home sales in Tallahassee continues to rise.

The home sales failure rate is the relationship between the number of homes leaving the market after having failed to sell versus the number of homes entering the market.

The number of new listings and new failures continues to fall, while the number of new pending home sales and new closed home sales continues to rise.

Knowing the next housing market trend is the one competitive advantage that homeowners have today that can help them be successful in selling their home. The key is to use this information and take decisive action.

Well, the seasonal housing inventory growth that we have been anticipating finally hit, and now the 30 day inventory trend is showing growth. This means there are more homes for sale in Tallahassee today than there were 30 days ago.

Historically the Northeast Tallahassee housing market has been hovering around the 50% of the market, so the current number appears more of a “return to normal” than anything else.

Wakulla, Jefferson, Gadsden and Leon counties are seeing a continued drop in both home values as well as average home prices. This trend will continue until the glut of homes for sale in Tallahassee and the surrounding areas is consumed.

Looking at North Florida homes for sale in the Tallahassee MLS uncovers way too much supply. The real estate graph shows over 18 months of supply of homes based upon the current rate of home sales.
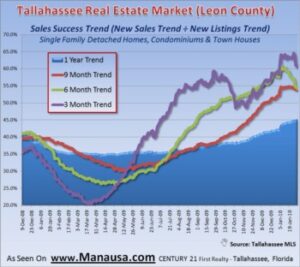
Home Sales Success Trend February 7, 2010 for the Tallahassee real estate market. Use this information to see if home owners are finding more or less difficulty in getting their homes sold.
Tallahassee Foreclosures Filings February 7, 2010: This is a list of properties that received a lis pendens filing in Tallahassee, for the week ending 2/7/2010.
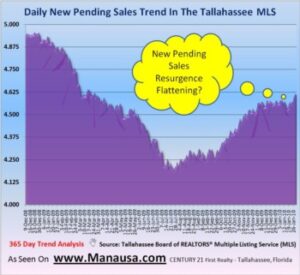
Tallahassee Pending Home Sales Report for February 6, 2010
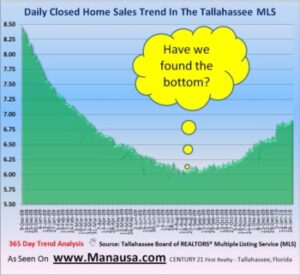
The daily closed home sales in the Tallahassee MLS had fallen to nearly 6 per day, after averaging closer to 8 per day for the previous 15 years!

Florida Bankers Association Bill: The Florida Consumer Protection and Homeowner Credit Rehabilitation Act has nothing to do with protecting consumers.
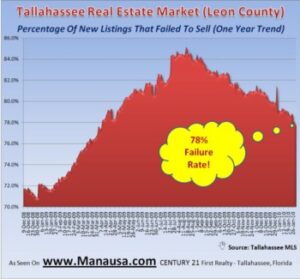
This failure rate in home sales is the measure of the number of homes that departed the market without a successful sale over the past 365 days, divided by the number of new listings during that same period of time.

Always consider the source when an article or report is being published about the state of the real estate market. If it is based upon MLS information, just know that in reality other sales (for the past) are being entered every day.
The following tables demonstrate housing supply and demand dynamics in the Tallahassee real estate market as of February 3, 2010. Each area of
Tell us where to send the Weekly Market Report. Each issue explains one shift in the Tallahassee market, like why nearly three in ten Leon County home buyers are paying cash.
Free. Unsubscribe anytime. Privacy policy