

Weekly Special | April 7, 2025
Four Key Housing Market Insights
Today’s report delivers four for the price of one!
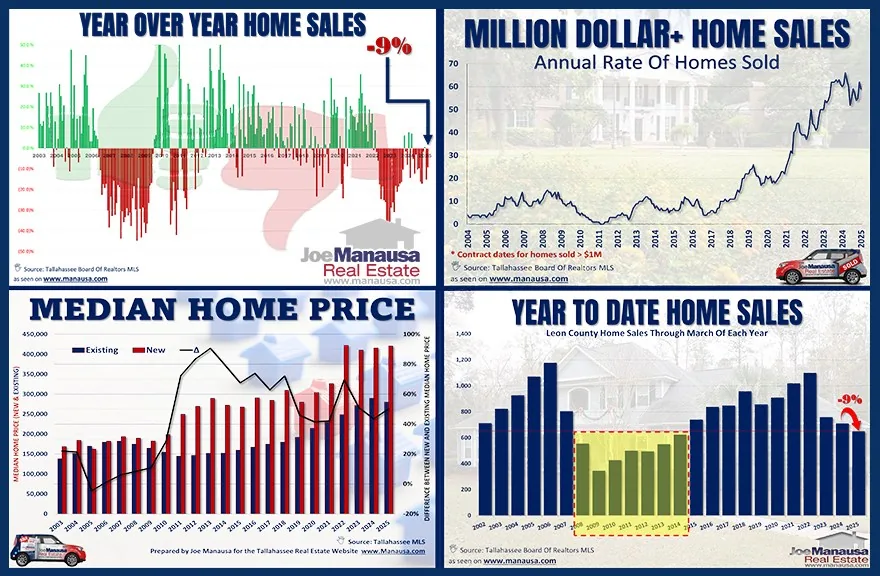
The top left graph shows that home sales in March fell 9% year-over-year, which is echoed in the bottom right graph where cumulative sales through March are also down nearly 9% compared to the same time last year.
In the bottom left graph, the blue line represents the median price of existing homes, the red line shows the median price of new homes, and the black line reveals that new homes currently cost 50% more than existing ones when measured by price per square foot.
This widened gap reinforces our long-standing belief that Tallahassee lacks the housing inventory needed to support its growing population. Back in the 1990s and early 2000s, new homes typically sold for just 5% to 15% more than existing homes. But over the past 15 years, inflation has driven new construction costs sharply higher.
Builders can no longer deliver the affordable homes that are needed in the market, so the divide between the “haves” and “have nots” is widening. Builders are building larger homes than the majority of the market needs, so expect the rental market to grow for the foreseeable future.
Finally, the top right graph highlights a surge in million-dollar home sales in recent years. Anyone who thinks the home affordability crisis is exaggerated should take a hard look at this trend.
These four trends offer a clear snapshot of the challenges and shifts shaping today’s housing market. Whether it’s declining sales, rising construction costs, or the growing divide between affordability and availability, the data points to a market under pressure.
The original one-page Weekly Special PDF is still available.
Get the Weekly Special Every Monday
Each Monday morning the Weekly Special takes one Tallahassee housing question, answers it with a chart of local sales, and explains what it means for your next move.
It is free, and you can unsubscribe any time.