
Tallahassee Monthly Lis Pendens Filings September 2011
The September 2011 Tallahassee Lis Pendens and Foreclosure summary shows roughly 50% of lis pendens that are filed have resulted in a foreclosure sale.
The September 2011 Tallahassee Lis Pendens and Foreclosure summary shows roughly 50% of lis pendens that are filed have resulted in a foreclosure sale.
Tallahassee Foreclosures Filings September 30, 2011: This is a list of properties that received a lis pendens filing in Tallahassee, for the week+ ending 9/30/2011


The upper end now is doing far better than it was in 2002, which might make you think “all is normal” with homes in Tallahassee.

Jefferson County, FL average real estate prices continue the 3 year trend of falling prices. Single family, lots, and mobile homes shown in graph
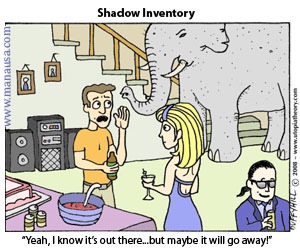
A new report on the real estate shadow inventory shows that this supply of homes is declining.

Looking at distressed home sales in Tallahassee, is there a correlation between age of homes and the frequency of them being sold?

Leon County, FL average real estate prices show signs of stabilization after 3+ years of falling prices. Single family, condo, lots, and mobile homes

REO and short sales in Tallahassee are on the rise again, even as our list of distressed properties for sale in Tallahassee.

The rate of home sales in Indian Head Acres appears to have returned to normal, as 2011 posts the most sold homes in the past four years.

Home sellers who are trying to wait for better days better have the staying power, as they will be greatly disappointed if they must sell soon.

Very recent activity in the Pending Home Sales Index shows signs of positive movement, as more buyers are active now than they have been recently.

Graph and map of Ox Bottom neighborhoods in Tallahassee, Florida showing home values decline 31% since the peak in 2006.
Tallahassee Foreclosures Filings September 21, 2011: This is a list of properties that received a lis pendens filing in Tallahassee, for the week ending 9/21/2011
Downtown Tallahassee home values have declined by more than 60% since the peak of the housing market, as our map of sales.

We will know when the housing market recovery begins before it happens if we just monitor the supply and demand in Tallahassee.

Bobbin Trace has accounted for more than half of all sales in the Bobbin Neighborhoods over the past 9 years, and 65% in the past 3 years.

The latest data on Tallahassee foreclosure sales is mixed, with declining foreclosures offset by a slight rise in new lis pendens filings.
Tallahassee Foreclosures Filings September 14, 2011: This is a list of properties that received a lis pendens filing in Tallahassee, for the week ending 9/14/2011
Tell us where to send the Weekly Market Report. Each issue explains one shift in the Tallahassee market, like why nearly three in ten Leon County home buyers are paying cash.
Free. Unsubscribe anytime. Privacy policy