

Weekly Special | October 4, 2021
It’s Not Just Home Prices Exploding
In my pursuit to find evidence of an impending housing bubble, I continue instead to find evidence of the opposite.
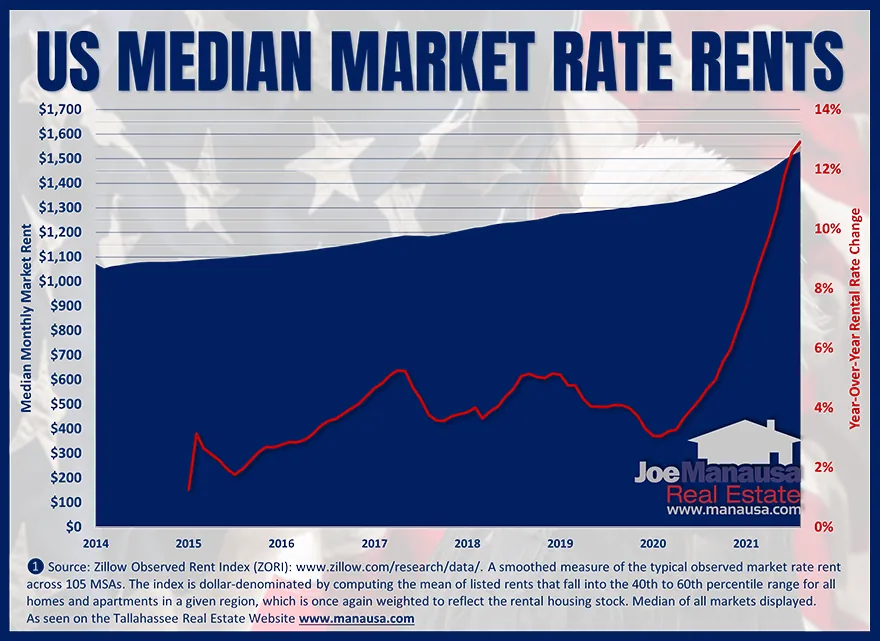
The graph above comes from a dataset produced by Zillow, created to share rental rates from most of the larger US metropolitan areas. Without getting to “mathy,” they cut a slice out of the middle of the rental market (by choosing listed rents that fall into the 40th to 60th percentile range for all homes and apartments) and report the median rent each month. I took this data and found the median monthly rental rate for the period that begins in January of 2014 and extends through August of 2021.
The blue field plots the median monthly rental rate, while the red line reports the year-over-year change of this rental rate.
Does this look familiar to you? It sure does to me!
Apparently, it’s not just home prices and values that are skyrocketing, so too are rental rates. August rental rates were nearly 13% higher than were rental rates in August of last year, and that is awfully close to the run away rate of appreciation that we’re seeing with existing home sales. This only reinforces my concerns about home affordability and a decline in the homeownership rate.
The original one-page Weekly Special PDF is still available.
Get the Weekly Special Every Monday
Each Monday morning the Weekly Special takes one Tallahassee housing question, answers it with a chart of local sales, and explains what it means for your next move.
It is free, and you can unsubscribe any time.