
Weekly Special | October 11, 2021
Thirteen Gains In A Row Year Over Year
Year over year home sales rose 8% in September, registering the thirteenth-straight month of gains and a growth streak in fourteen of the past fifteen months.
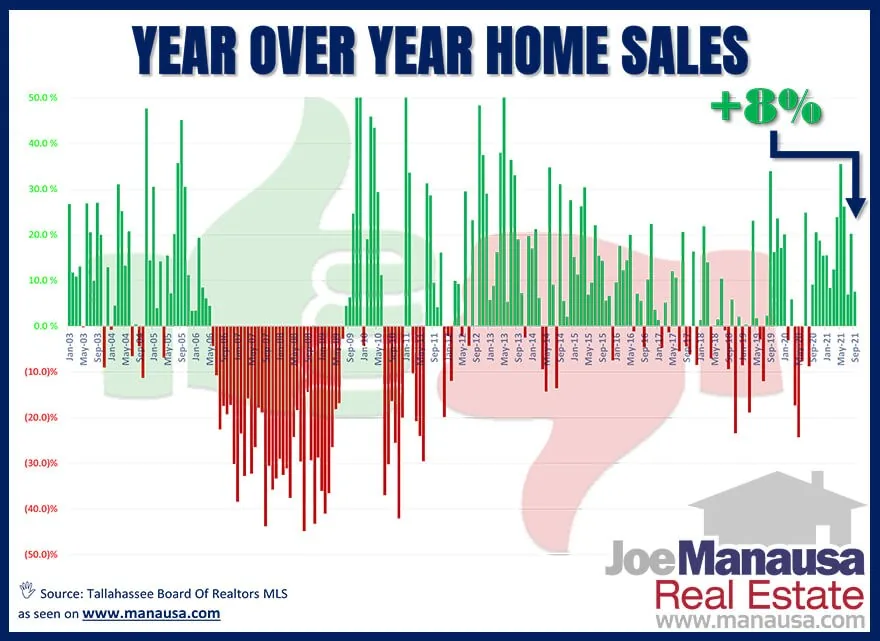
Today’s graph shows how each month’s sales compared with the same month the year prior. We refer to this as the year-over-year home sales report.
Year over year home sales comparisons provide insight into the market changes by removing the seasonal influences in the market. Even a cursory glance at this graph tells you that this market is hot. There is so much more green than red.
Interest Rates Are Driving Sales Most of us in the real estate industry will tell you that the only reason this market remains so vibrant is that historic low mortgage interest rates are making buyers come out to participate. For this reason, I believe that the duration of this housing market growth cycle will be determined by the future changes to mortgage interest rates.
With rates today still sitting near 3% for a 30-year fixed rate loan, buyers are able to get so much more home for their money than in the past. This has created a real fear of missing out for many buyers, but it also means that rising rates could very well bring a “sticker shock” to the market that causes home sales to plummet until wage inflation helps home affordability to recover.
Pay attention to the pace at which mortgage interest rates rise, as it will determine just how vibrant home sales remain in the coming months and years.
The original one-page Weekly Special PDF is still available.
Get the Weekly Special Every Monday
Each Monday morning the Weekly Special takes one Tallahassee housing question, answers it with a chart of local sales, and explains what it means for your next move.
It is free, and you can unsubscribe any time.