
Weekly Special | September 27, 2021
Lack Of New Homes = Soaring Values
I like to track the average value of both new and existing homes that have sold in order to see how far apart they are. In this graph, we’ve plotted the average new home value (in price per square foot) in red, and existing home values are plotted in blue. The difference (the Delta) is plotted in gray (highlighted in yellow) and is reported on the right vertical axis.
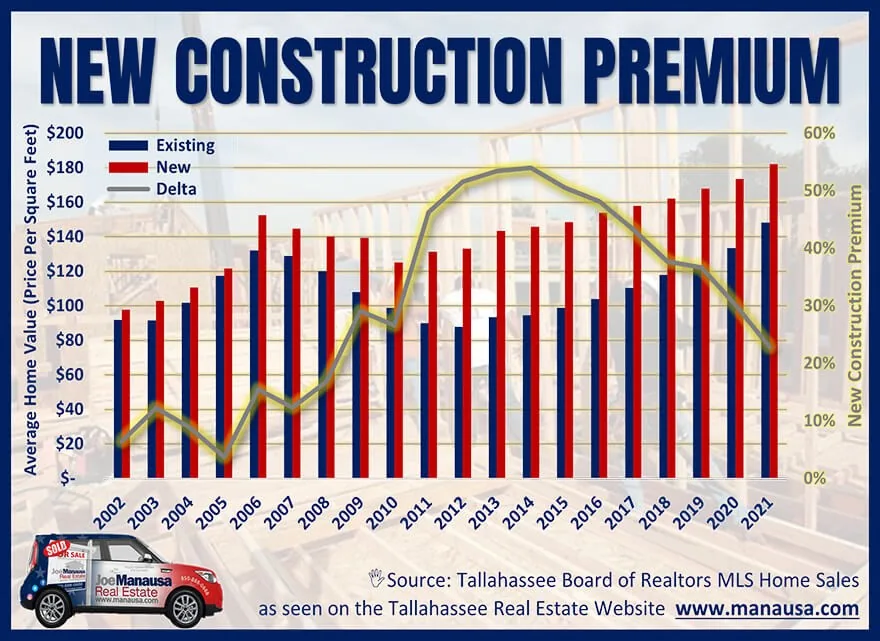
What I’m looking for in this graph is found by following the delta between the two, and it has fallen to 23%, the lowest we’ve seen in twelve years! Simply put, relative to used homes, new homes are more affordable than we’ve seen since 2009!
What’s interesting is that from 2000 through 2007, the average difference in values between new and used was less than 10%. This is an important fact that explains the big difference between today’s soaring market and the market that formed the housing bubble of 2006.
Twenty years ago, builders were able to produce homes that a large portion of the homebuyer pool could afford. When loan standards declined, more buyers entered the market, and builders were able to deliver the products they wanted.
In fact, due to the relationship between new and used, builders were able to flood the market with inventory, and when the crazy loan products were canceled, demand dropped and the market was left with a glut of homes, many of which were brand new construction.
Second graph and article continued here
This issue went with a longer report on our blog: read the full blog post. The original one-page Weekly Special PDF is still available.
Get the Weekly Special Every Monday
Each Monday morning the Weekly Special takes one Tallahassee housing question, answers it with a chart of local sales, and explains what it means for your next move.
It is free, and you can unsubscribe any time.