
Weekly Special | December 14, 2015
Continued Gains For Tallahassee Home Sales
Year over year home sales improved 1.5% in November, representing the 15th consecutive month of gains.
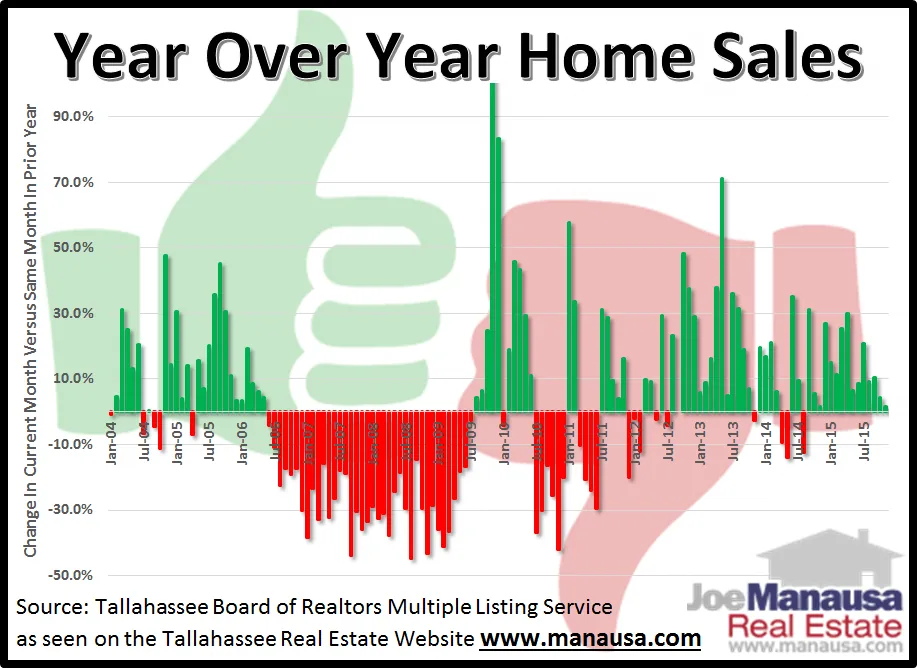
As a reminder, year over year calculations merely measure the number of home sales in a month and compare it to the same month during the prior year. So the 199 homes sold in November 2015 were 1.5% more than the 196 homes sold during November of 2014.
Remarkably, 36 out of the past 40 months have shown gains in our year over year analysis, certainly a direct sign of improving times for people with homes to sell in Tallahassee, Florida.
The graph above makes it easy to see how this report has been progressing.
Months that record gains are shown in green, while months that failed to gain are shown in red.
The months from June 2006 through July 2009 represented 36 straight months of declines, a very dark period for those of us with a stake in the Tallahassee housing market.
Fortunately, times change.
Based upon the current number of home sales recorded each month (and comparing this with the number of sales reported in the past), I suspect we have another positive year coming up, though it is likely a few months will decline.
The original one-page Weekly Special PDF is still available.
Get the Weekly Special Every Monday
Each Monday morning the Weekly Special takes one Tallahassee housing question, answers it with a chart of local sales, and explains what it means for your next move.
It is free, and you can unsubscribe any time.