
Weekly Special | December 28, 2015
The Big Takeaway From 2015
The Tallahassee housing market had its strongest year of the recovery, and when the final numbers can be tallied in a few weeks, it will make for an exciting end of year report.
But we do not need those final numbers to assess the impact of this year’s performance on our present situation.
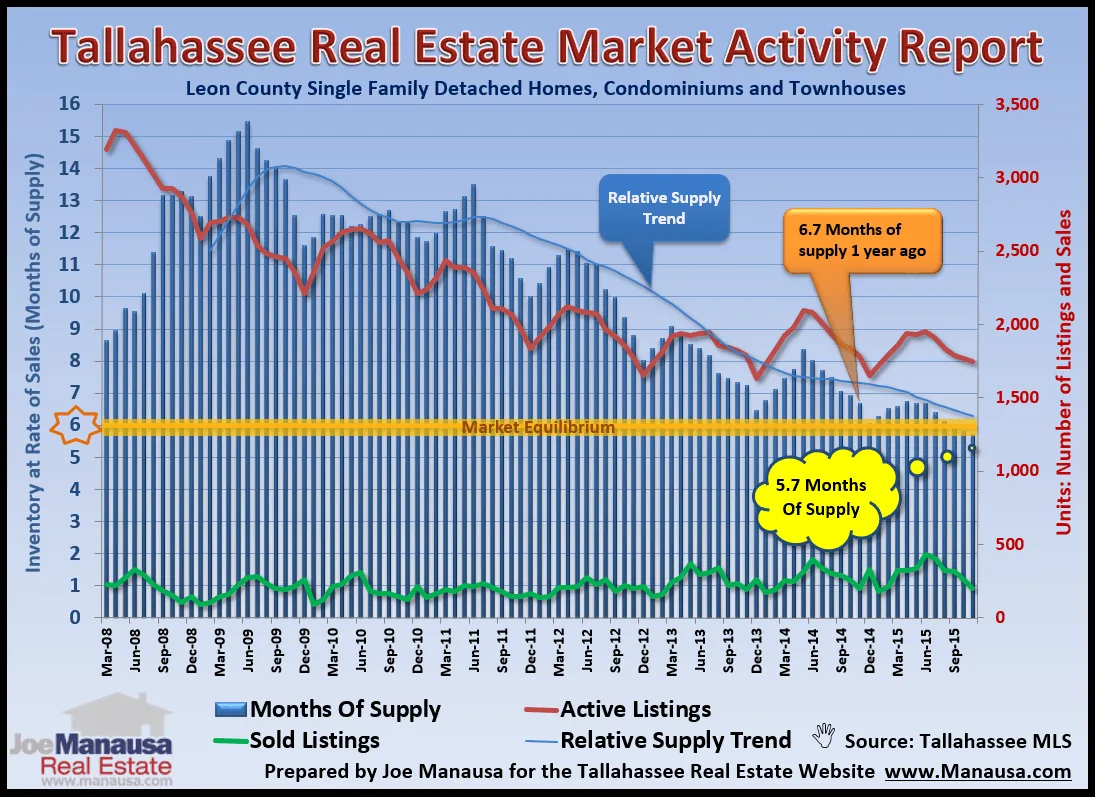
The graph above is a monthly snapshot of the supply and demand for homes in Tallahassee.
The red line shows the number of homes currently listed for sale each month, while the green line shows the number of homes sold each month. We then calculate the months of supply of homes and track this level on the left vertical axis.
The magic number the market is seeking is 6.0 months of supply. The blue line shows the seasonally adjusted relative supply trend, and it has dropped from a whopping 14.0 months of supply in 2009 down to an acceptable 6.2 months of supply in December.
This means that the overall housing market in Tallahassee is almost in balance, where supply is almost the perfect level for the current rate of demand. It’s been a long time coming.
It is highly likely that 2015 will bring this blue line below 6.0 months of supply, meaning that the overall market is transitioning towards a seller’s market.
This will definitely be the case in some areas and some price ranges, but we still expect high-end and low-end homes to be over supplied throughout all of ‘16.
The original one-page Weekly Special PDF is still available.
Get the Weekly Special Every Monday
Each Monday morning the Weekly Special takes one Tallahassee housing question, answers it with a chart of local sales, and explains what it means for your next move.
It is free, and you can unsubscribe any time.