
Weekly Special | June 14, 2021
Is This The New Normal For Sellers?
Today’s report takes a look at how sellers are doing compared to “normal” times. The graph above plots the percentage of listings that sell each month (red dots measured on the right vertical axis).
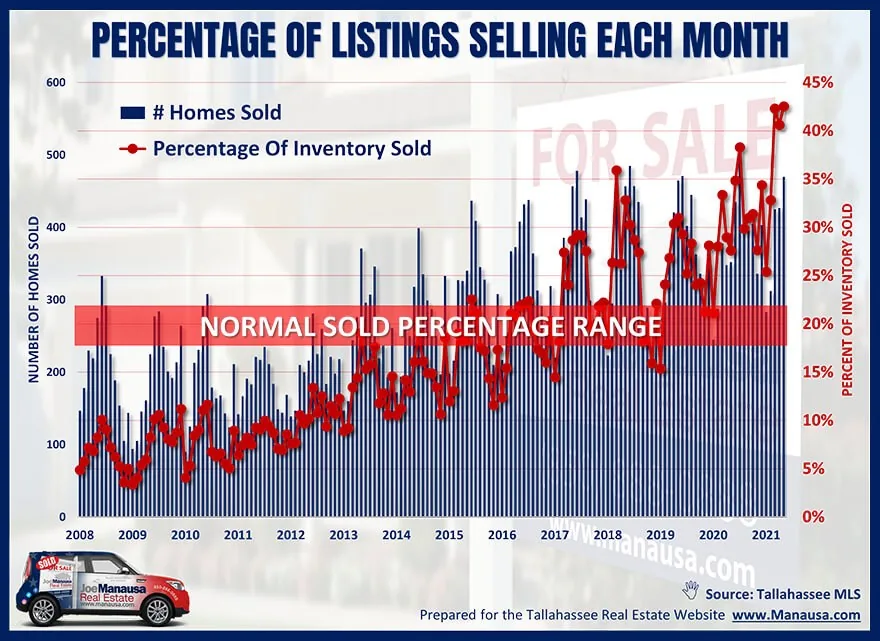
The red field has been considered the “normal range” for the past thirty years that I have been selling homes in Tallahassee. I’ve only been collecting data on this since 2008, so we’re basically looking at thirteen years worth of information, but it says a lot.
During the housing market crash and recovery from 2007 through 2015, we saw lower than normal sales percentages. This means that supply was higher than demand and as little as 3% of homes listed for sale were actually selling in any given month.
But times change. Now we’re typically seeing more than a third of all listings sell each month, and we’re currently seeing three straight months that more than 40% of the inventory sold.
This means that demand is now significantly higher than supply and the inventory is turning-over much more quickly than what has been seen as normal.
You should understand that these numbers are not equally distributed across all areas and price ranges in the market, so you will need to use more specific information when selling. But know this:
This is the best time for selling a home within a predictable time frame that I have seen in the past 30 years!
The original one-page Weekly Special PDF is still available.
Get the Weekly Special Every Monday
Each Monday morning the Weekly Special takes one Tallahassee housing question, answers it with a chart of local sales, and explains what it means for your next move.
It is free, and you can unsubscribe any time.