
Weekly Special | February 14, 2022
Strong January For Tallahassee MSA
Year over year home sales for the entire Tallahassee MSA rose 40% in January, registering the twentieth month of gains compared to only five months of declines since the start of 2020.
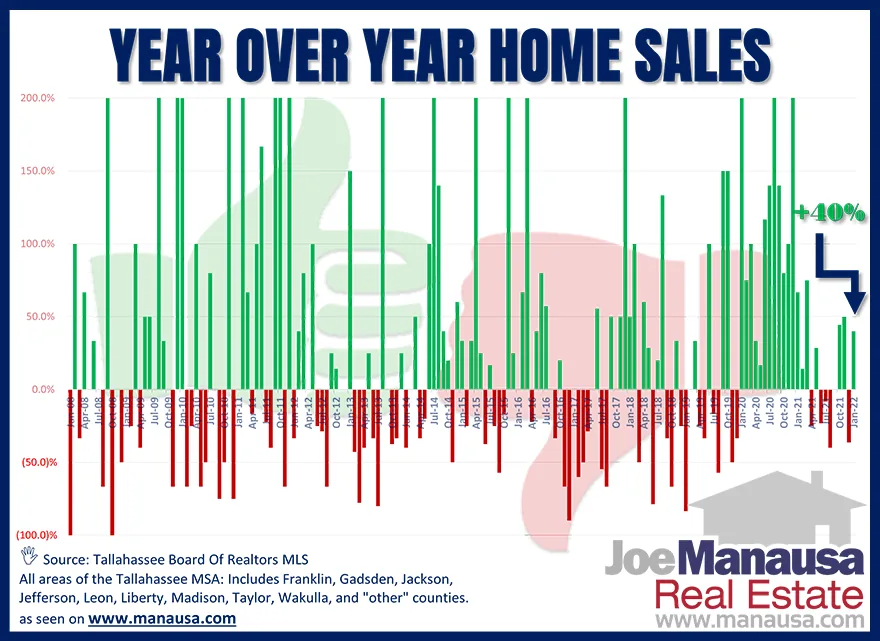
This graph shows how each month’s sales compared with the same month the year prior. We refer to this as the year-over-year home sales report.
Year-over-year home sales comparisons provide insight into the market changes by removing the seasonal influences in the market. Even a cursory glance at this graph tells you that this market is hot. There is so much more green than red in recent years.
One thing that I see from this (versus Leon County only year-over-year) is that there are more ups and downs in the overall MSA than there are in just Leon County. Year-over-year figures for January are as follows:
• Franklin County: +40% • Gadsden County: +11% • Jackson County: -100% • Jefferson County: +60% • Leon County: +15% • Liberty County: 0% • Madison County: +11% • Taylor County: -9% • Wakulla County: -2% • Overall Tallahassee MSA: +40%
The original one-page Weekly Special PDF is still available.
Get the Weekly Special Every Monday
Each Monday morning the Weekly Special takes one Tallahassee housing question, answers it with a chart of local sales, and explains what it means for your next move.
It is free, and you can unsubscribe any time.