
Weekly Special | February 7, 2022
Uptick In Distressed Properties
There has been a noticeable uptick in distressed properties hitting the market over the past two months so I figured it would be a great time to address what this means.
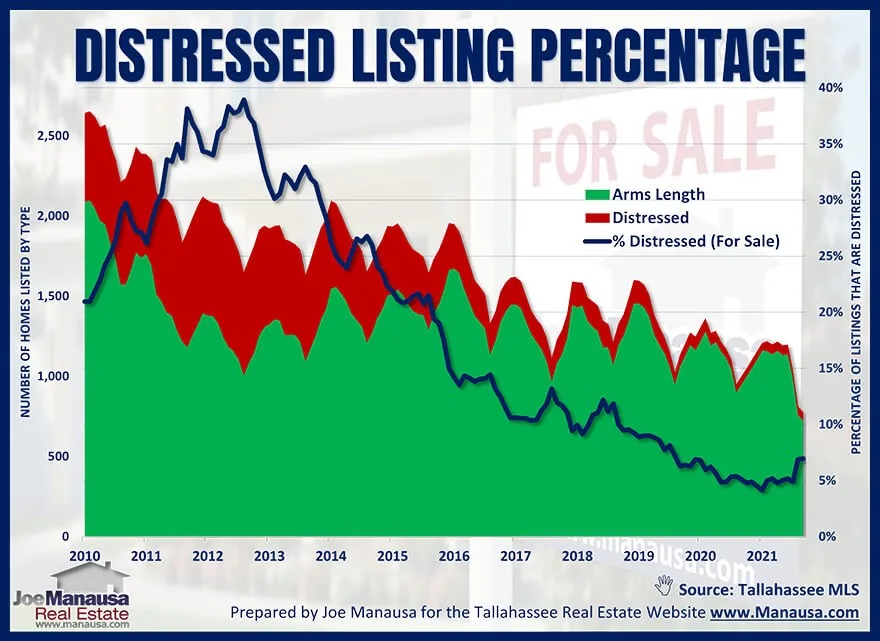
The graph above examines the active inventory of homes for sale since 2010, segmented by arms-length (healthy) sellers shown in green, and distressed (unhealthy) sellers shown in red. The blue line reports the percentage of homes on the market that are distressed and the yellow arrow identifies the recent spike.
Currently, 7% of all active listings are distressed properties (short sales, pre-foreclosures, and foreclosure sales). This is up from a low of 4.1% last summer, and roughly the same as pre-COVID market conditions.
Any time there is a move higher in distressed properties, it gets my attention and I want to know why.
Fortunately, the reason today is obvious, and it causes no worries at all. There has been a moratorium on foreclosures which commenced March 18, 2020 due to COVID and that ended late in 2021. Many banks pushed the date back further to the end of the year.
I believe the recent spike is just the result of pent-up foreclosure actions and we’ll see it was through the market fairly quickly. Remember, homes are appreciating rapidly and there is not enough inventory, so most people who are in a forced-sale situation are likely to be able to pull some equity from their homes, even after catching up with very late payments on their mortgages.
The original one-page Weekly Special PDF is still available.
Get the Weekly Special Every Monday
Each Monday morning the Weekly Special takes one Tallahassee housing question, answers it with a chart of local sales, and explains what it means for your next move.
It is free, and you can unsubscribe any time.