
Weekly Special | February 21, 2022
Five Straight Months Of Declines
Year over year fresh new listings were down a whopping 30% in January, recording the fifth straight month of declines. In a market where inventory was far too low, this has made for extreme conditions.
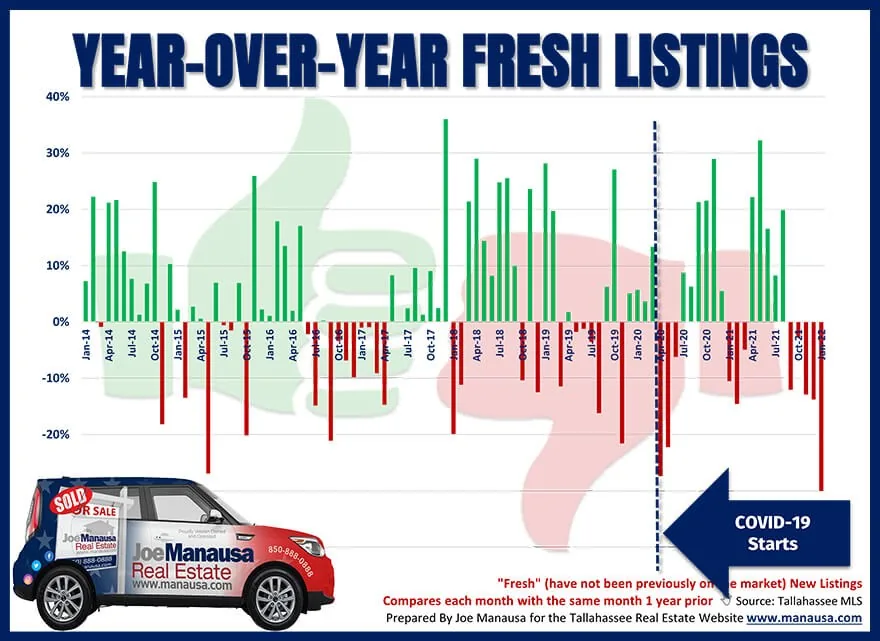
This week’s graph displays the count of year-over-year fresh listings entering the market. It compares each month of the year with the same month from the year prior. We’re looking at the change in fresh new listings entering the market, where “fresh” means we only consider homes that were not previously listed for sale.
Existing homes that entered the market in January are 26% fewer than in January of last year and fewer than in all January months for the past nine years.
New construction listings were 53% fewer than those listed in January of last year and the second fewest of all January months for the past nine years.
With inventory shortages being pronounced and obvious since 2016, we need to see local builders produce fresh new construction listings at a much faster rate.
Unfortunately, that is not going to be the case in the near future. The video below will show you why.
The original one-page Weekly Special PDF is still available.
Get the Weekly Special Every Monday
Each Monday morning the Weekly Special takes one Tallahassee housing question, answers it with a chart of local sales, and explains what it means for your next move.
It is free, and you can unsubscribe any time.