
Weekly Special | August 10, 2015
Supply Of Homes Continues To Improve
The relative supply of homes continues to improve in the Tallahassee real estate market.
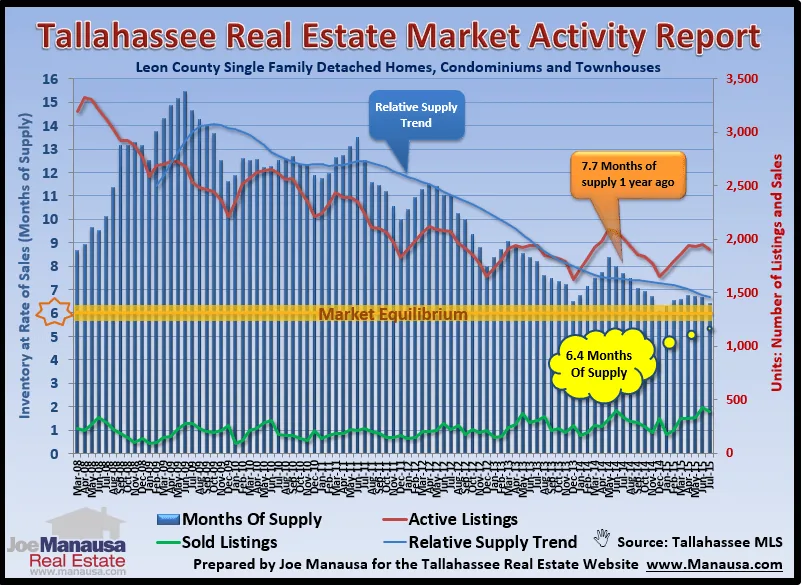
The eight-year glut of homes has been reduced to a seasonally adjusted level of 6.6 months of supply, meaning that we are very close to market equilibrium.
As a reminder to our long-term readers, we consider 6.0 months of supply a “balanced market,” and this is a level last seen in early 2007.
In the graph above, monthly home sales are plotted in green (measured on the right vertical axis) and the total number of listings each month is shown in red (also plotted on the right vertical axis). The resulting months of supply of homes, or relative supply, is shown as blue columns and plotted on the left vertical axis. The 12 month average relative supply is shown as a blue line, and it is finally approaching market equilibrium.
As the Summer selling season is winding down and fewer sellers enter the market, we are seeing the typical reduction in both real and relative supply.
This is going to be the first year where we approach a perfectly balanced market, which of course is not evenly distributed across all price ranges and all areas. The high end and the West side of town are still over-supplied.
The original one-page Weekly Special PDF is still available.
Get the Weekly Special Every Monday
Each Monday morning the Weekly Special takes one Tallahassee housing question, answers it with a chart of local sales, and explains what it means for your next move.
It is free, and you can unsubscribe any time.