
Weekly Special | August 3, 2015
Housing Recovery Continues For Tallahassee
Year over year home sales rose again in July, marking the 11th consecutive months of gains for the Tallahassee housing market.
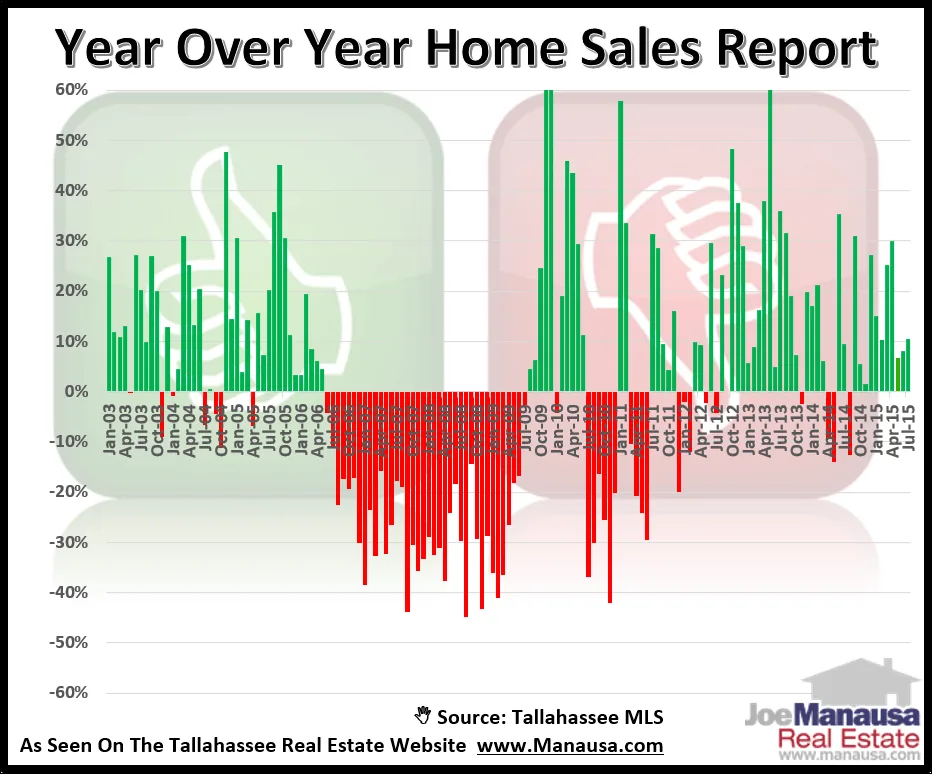
In the graph above, the number of homes sold and recorded each month in the Tallahassee MLS is compared with those sold during the same month of the prior year (for example, 10% more homes were sold in July 2015 versus July 2014).
And this current positive trend is nothing new. The number of home sales each month has been growing fairly consistently over the past four years.
In the past three years alone, Tallahassee has recorded only four declining months compared with 32 months of gains.
The continuation of the recovery is great news to report, but there is much more upside remaining before our market is back to “normal” conditions.
Over the past 12 months, the Tallahassee MLS has reported, on average, 297 home sales each month. This is up strongly over the past few years, but by way of comparison, there were 310 home sales each month in 2001. This means our market is still down 4% compared to a fairly normal year 14 years ago, and our population has grown enough since that time to expect an equivalent rise in sales.
The original one-page Weekly Special PDF is still available.
Get the Weekly Special Every Monday
Each Monday morning the Weekly Special takes one Tallahassee housing question, answers it with a chart of local sales, and explains what it means for your next move.
It is free, and you can unsubscribe any time.