
Weekly Special | February 24, 2020
18-Year View Of Home Price Change
Don’t let the graph above overwhelm you, it merely shows what buyers have spent for a home in Tallahassee in 2 separate years.
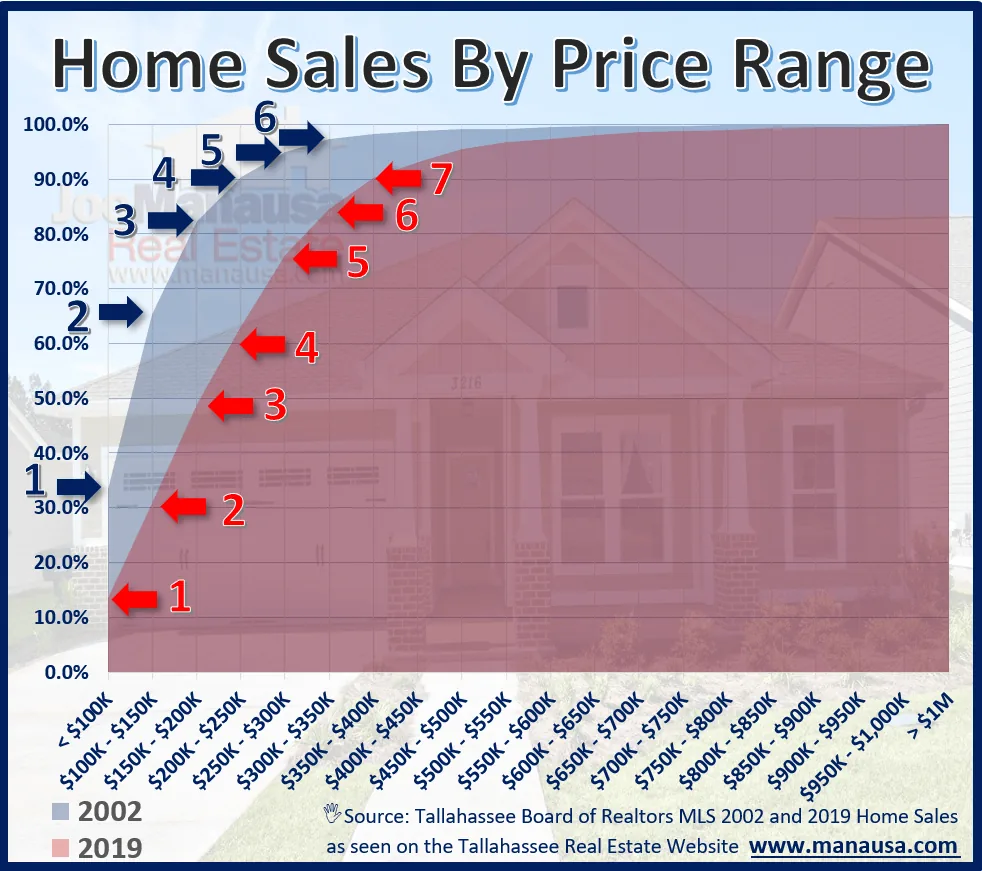
The area shaded in blue plots homes sold in 2002 while the area shaded in red plots 2019 home sales. Each price range of the homes sold are measured on the horizontal axis, while the percentage of all homes sold is measured on the vertical axis.
The great value in this graph is it allows us to see what people are spending for homes now versus what they were spending 18 years ago.
A few interesting facts:
33% of homes were less than $100K then versus 14% of homes now 66% of homes were less than $150K versus 33% of homes now The top 1% of buyers paid more than $450K then versus today’s top 1% pays more than $900K.
With low inventories and strong demand, expect price to continue to grow at alarming rates.
The original one-page Weekly Special PDF is still available.
Get the Weekly Special Every Monday
Each Monday morning the Weekly Special takes one Tallahassee housing question, answers it with a chart of local sales, and explains what it means for your next move.
It is free, and you can unsubscribe any time.