
Weekly Special | March 2, 2020
Is It Merely A Bump, Or A Turn?
How healthy is the Tallahassee real estate market? Well, that question is far to broad to answer in a quick-hitting one-page report, but we can learn about market health by examining foreclosure sales.
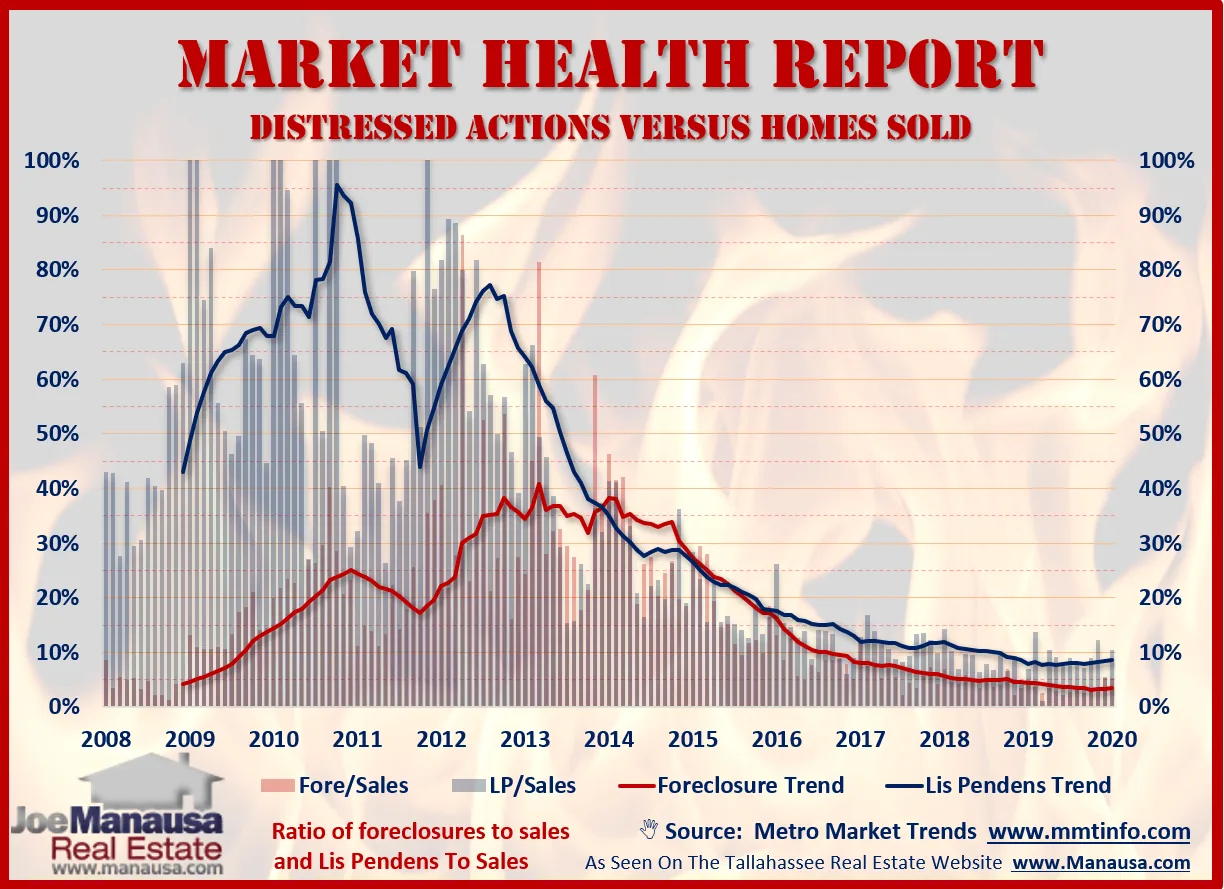
For example, if the majority of home sales are distressed properties, one could conclude that the market is unhealthy (people are losing their homes at a high rate). On the other hand, if foreclosure sales are few, one could argue that the market is doing well.
The blue and red lines represent the one-year average of lis penden filings (the start of the foreclosure process)
while the red line measures the one-year average of foreclosure sales (the conclusion of the foreclosure process). Each is measured as a ratio of closed home sales.
Now Versus Then What these two trends show is a housing market that has been getting healthier since 2010 when every 100 homes sold had a simultaneous 95 lis pendens filed. Today’s market is clearly healthier than ten years ago.
Unfortunately, it appears the declining trend on new filings has bottomed (at best) or perhaps is on the rise. Is this a start of a new trend due to the softer lending requirements we’ve seen recently or merely a normal bump in the data?
The original one-page Weekly Special PDF is still available.
Get the Weekly Special Every Monday
Each Monday morning the Weekly Special takes one Tallahassee housing question, answers it with a chart of local sales, and explains what it means for your next move.
It is free, and you can unsubscribe any time.