
Weekly Special | February 17, 2020
Home Values By School Zone Vary
The Tallahassee real estate market, normally very steady and stable, followed the national trend of irrational exuberance in the early 2000’s followed by a crash in 2 0 0 6 and a recovery that commenced in 2012.
Those dates should be considered in general terms, as the rise, crash, and recovery did not being and end at the exact same time for all areas and price ranges in town.
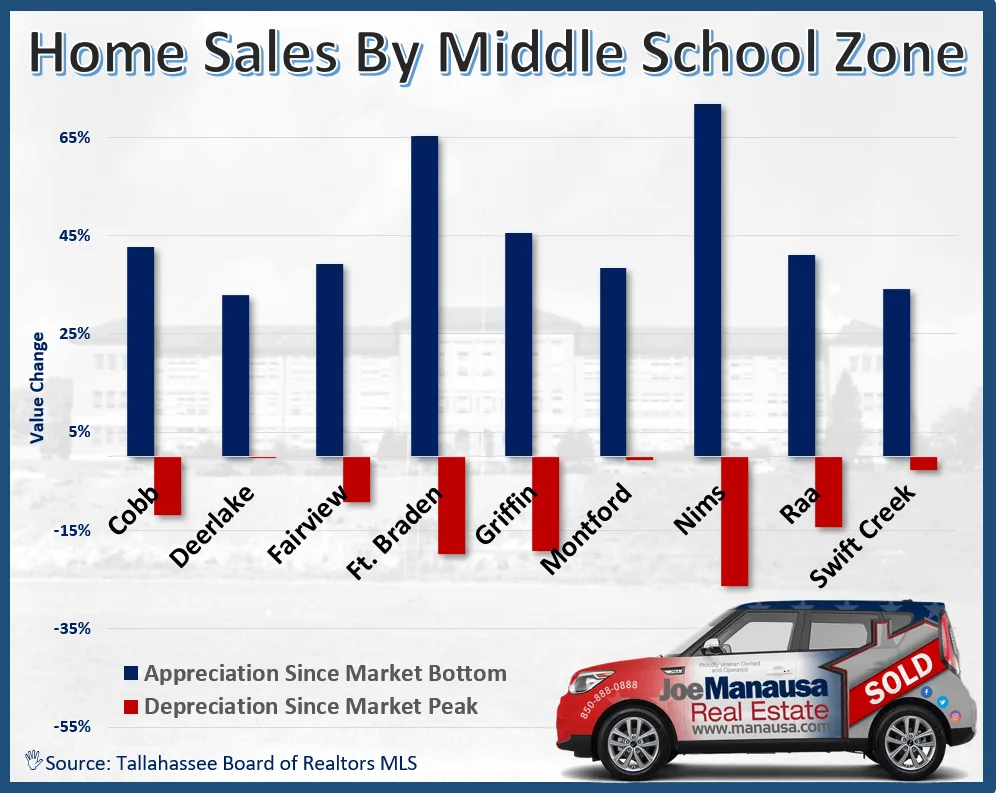
The graph above plots the percentage change of home values today versus the past market high and the past market low (after the high). Simply put, it shows how much each middle school zone has improved since the bottom of the market (blue), and how far each zone remains from creating a new market high (red).
Homes zoned for Deerlake Middle School, for example, have appreciated 33% since the market bottom, and currently are less than 1/2% away from setting a new market high.
On the other end of the volatility scale, the homes zoned for Nims Middle School have appreciated 72% since the market bottom yet remain a full 26% below the level needed to set a new market high.
The original one-page Weekly Special PDF is still available.
Get the Weekly Special Every Monday
Each Monday morning the Weekly Special takes one Tallahassee housing question, answers it with a chart of local sales, and explains what it means for your next move.
It is free, and you can unsubscribe any time.