
Weekly Special | February 28, 2022
Bumpy Ride For Housing Is Here
This week’s graph shows why we’re not going to be able to fix the housing market in the same way the last one was fixed. It measures what Zillow refers to as the “typical observed market rental rate” by taking a swipe from the middle of the market to approximate the median.
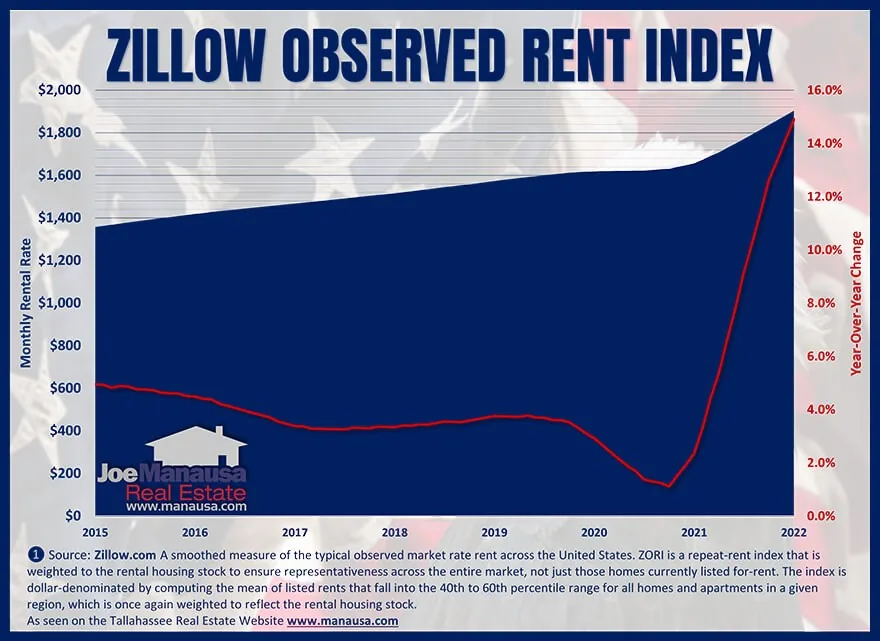
The blue area measures the rental rate index each month (median rent) while the red line plots the year-over-year percentage change each month. It is this red line that should make your head spin.
As the inventory of homes for sale has declined, so too has the inventory of homes for rent. How do we know this? Well, in January, the median US rental rate of $1,904 was nearly 15% higher than the median rental rate of $1,657 recorded in January of 2021.
Can you imagine if your monthly rent was increased from $1,650 to $1,900 per month? If the rate remains the same over the next year, that same median unit will rent for $2,190 per month, a rent hike of more than $500 monthly in just two years!
So why do rents matter? Because the last housing market fixed had people who needed housing shift from the “for sale” market to the “for rent” market.
This time, rents are going to be a lot higher than what people are used to paying, and so too will be mortgage payments because interest rates and home prices continue to rise.
Ensure your seat belt is buckled, housing is going to become a very bumpy ride!
The original one-page Weekly Special PDF is still available.
Get the Weekly Special Every Monday
Each Monday morning the Weekly Special takes one Tallahassee housing question, answers it with a chart of local sales, and explains what it means for your next move.
It is free, and you can unsubscribe any time.