
Weekly Special | May 30, 2016
New Home Sales Sustain Healthy Growth
The number of newly built homes selling each month continues to move higher, something that helps local builders (and the local economy) immensely.
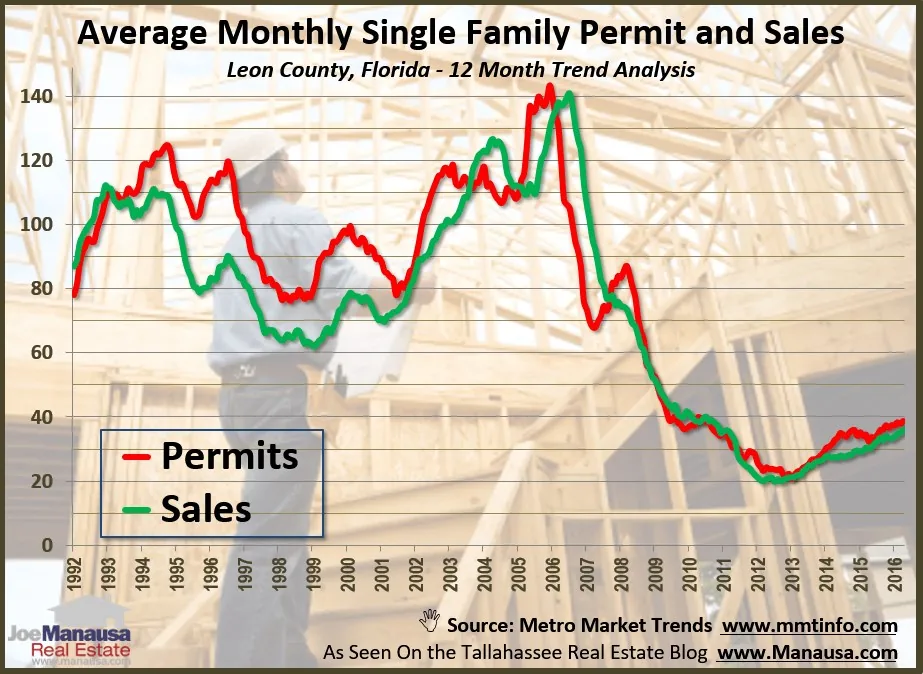
Unlike other growth periods in the past, the number of new home permits appears to be managed very well. There have been times when new permits far out-paced new home sales and it resulted in over-supply and pricing pressure on home sellers.
In the graph above, the one-year average of new home permits issued each month is shown in red, while the one-year average of new home sales is shown in green.
Since the new home sales market bottomed in 2012, we have seen a steady rise and new home sales have nearly doubled in less than four years.
Historical Perspective I do not have new construction information for the years prior to 1991, so we have just 26 years to use for perspective.
The current rate of new home construction and sales is running far lower than we have seen in the past. The following shows the average number of monthly new home sales each decade:
1990’s: 95 2000’s: 109 2010’s: 31 How’s that for perspective? New construction sales are currently at a pace that is roughly 1/3rd the rate we’ve seen for the prior two decades.
The original one-page Weekly Special PDF is still available.
Get the Weekly Special Every Monday
Each Monday morning the Weekly Special takes one Tallahassee housing question, answers it with a chart of local sales, and explains what it means for your next move.
It is free, and you can unsubscribe any time.