
Weekly Special | June 5, 2016
Fewer Homeowners In Trouble As Values Rise
The number of homeowners whose debt exceeds their equity is falling at a hearty pace in Tallahassee.
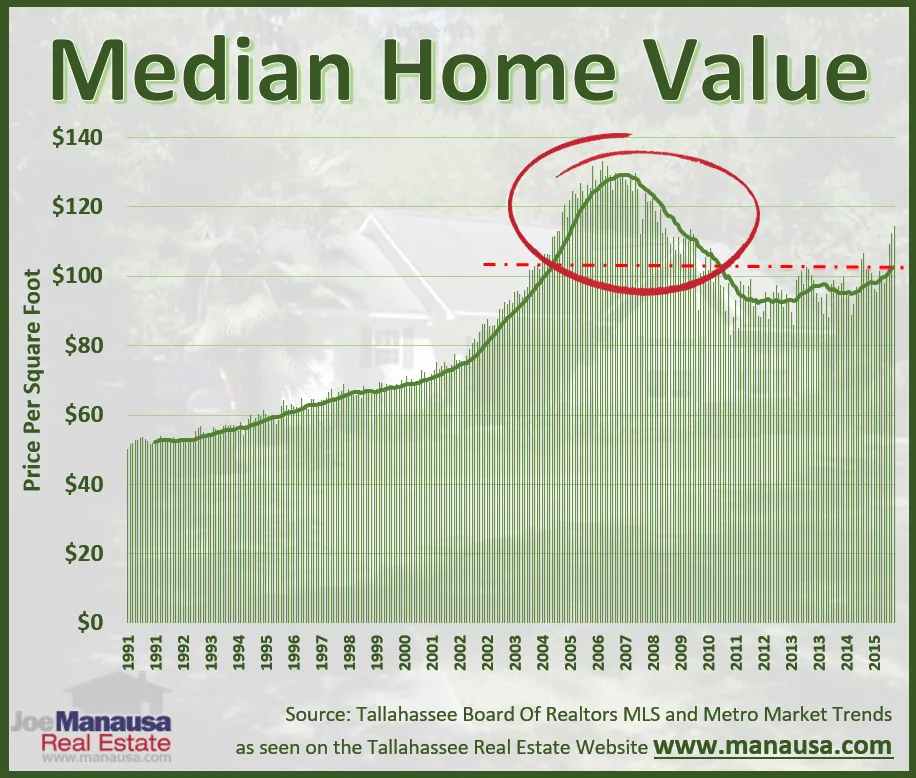
The graph above plots the median home sales price each month and the one-year average (value trend) is shown as a dark green line.
The red dotted line is used to show that there is a five+ year window where home values were higher than they are today. As home values creep higher, the period of time where values were higher shortens.
Roughly 20,000 homes were sold during the circled period of time, and I suspect the same amount or more were refinanced with a loan that resulted in similar equity positions as new buyers faced.
From this large group of homeowners, we can subtract homes that have since been re-sold for whatever reason and we can slightly reduce the debt for those that have been paying-down amortized loans.
I suspect that still leaves us with 20,000 to 30,000 “upside-down” owners who have owned their homes for ten or more years. This segment of the market represents both pent-up supply as well as (roughly half as much) pent-up demand, meaning both sellers and buyers will emerge as home values rise.
The original one-page Weekly Special PDF is still available.
Get the Weekly Special Every Monday
Each Monday morning the Weekly Special takes one Tallahassee housing question, answers it with a chart of local sales, and explains what it means for your next move.
It is free, and you can unsubscribe any time.