
Weekly Special | May 22, 2016
Strengthening Market Continues Higher
The number of homes selling each month continues to move higher, a solid sign that the housing market in Tallahassee continues to strengthen.
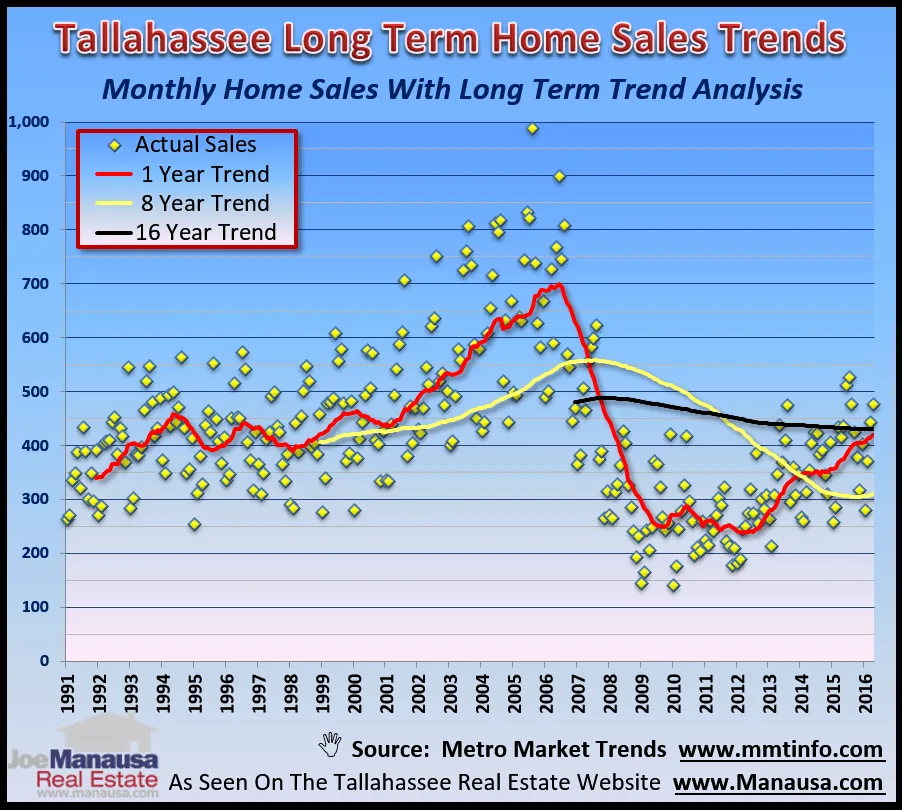
In the graph above, the yellow dots record the number of homes sold each month, from April of this year all the way back to January 1991. It’s important to note that these are all home sales recorded in Leon County, not just MLS sales.
The one-year trend (average) of monthly home sales is plotted with a red line, the eight-year trend is shown in yellow, while the black line reveals the sixteen year trend.
Our data seems to support an eight year cycle for the Tallahassee housing market, and for the first time in more than sixteen years, the eight-year trend has turned higher. Hopefully, we’ll see the longest trend line turn north soon.
More To Follow We expect to see the number of homes sold each continue to rise for the foreseeable future since the current rate is still far lower than what we experience in the late 1990s (when there were 25% fewer people in Tallahassee).
The original one-page Weekly Special PDF is still available.
Get the Weekly Special Every Monday
Each Monday morning the Weekly Special takes one Tallahassee housing question, answers it with a chart of local sales, and explains what it means for your next move.
It is free, and you can unsubscribe any time.