
Weekly Special | May 8, 2023
Inventory Remains Near All-Time Low
Just as in Tallahassee, the inventory of homes for sale in the US remains just above an all-time low.
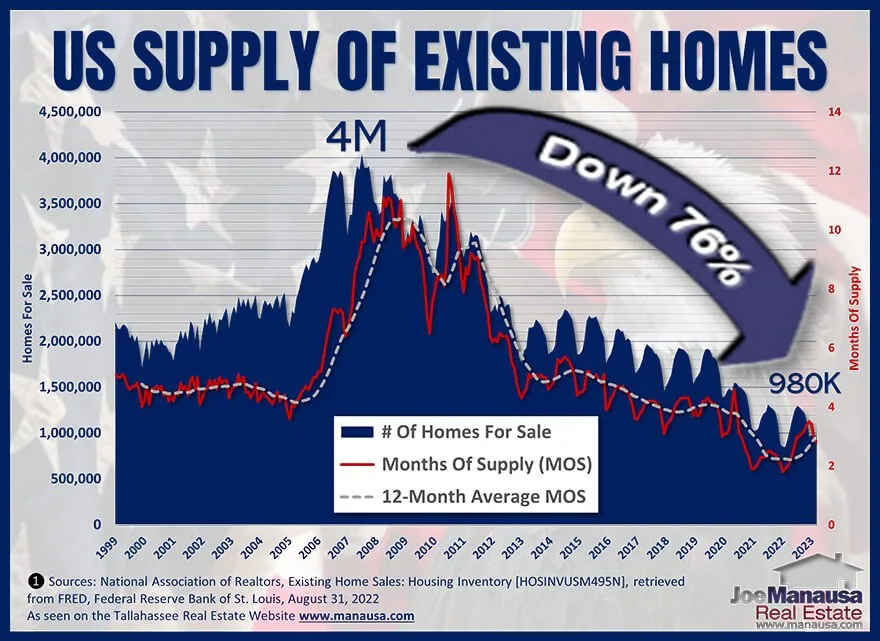
This graph plots the real supply of existing homes for sale in the US in blue, calculates the months’ supply of homes for sale in red (also known as the relative supply of homes), and then records the one-year average of the relative supply of homes for sale.
Historically, market equilibrium (balanced market) is achieved when six months supply of homes exists.
The first thing that jumps out of this graph is that only 980K existing homes are for sale in the US. That is 76% fewer homes than were available in 2006 when the housing market collapsed.
When mortgage interest rates soared after the first quarter last year, many real estate media pundits claimed that inventories of unsold homes would pile up and home prices would plummet.
Instead, we see supply falling (nearly) in line with demand. This means the relative supply of homes has not exploded above 6.0 months of supply. Instead, it has ticked up to its current “just off the bottom” level of 2.8 months of supply.
Home sales could very well heat back up as mortgage interest rates have stabilized, and that will only put more heat on the lack of supply of homes for sale in our local housing markets.
The best way to control prices is to satisfy the demand for homes. We need to tone down the NIMBY rhetoric and deliver the shelter our population needs.
The original one-page Weekly Special PDF is still available.
Get the Weekly Special Every Monday
Each Monday morning the Weekly Special takes one Tallahassee housing question, answers it with a chart of local sales, and explains what it means for your next move.
It is free, and you can unsubscribe any time.